
Arctic ice pack facts for kids

The Arctic ice pack or arctic ice cap is an ice shield covering the Arctic Ocean. It changes during the year. Usually, the ice melts in spring and summer, and increases during autumn and winter. The minimum cover is around mid-September. Summer ice cover in the Arctic is about half of winter cover. Some of the ice survives from one year to the next. Currently, 28% of Arctic basin sea ice is multi-year ice. Multi-year ice is thicker than seasonal ice: up to 3–4 m (9.8–13.1 ft) thick over large areas, with ridges up to 20 m (65.6 ft) thick. As well as the regular seasonal cycle there has been an underlying trend of declining sea ice in the Arctic in recent decades.
Contents
Climatic importance
Energy balance effects
Sea ice is important for the heat balance of the polar oceans: it insulates the (relatively) warm ocean from the much colder air above. With ice, less heat is lost from the oceans. Sea ice is highly reflective of solar radiation, reflecting about 60% of incoming solar radiation when bare and about 80% when covered with snow. This is due to a feedback known as the albedo effect. This is much greater than the reflectivity of the sea (about 10%). The ice also affects the absorption of sunlight at the surface.
Hydrological effects
The sea ice cycle is also an important source of dense (saline) "bottom water". When sea water freezes it leaves most of its salt content behind. The remaining surface water, made dense by the extra salinity, sinks and produces dense water masses such as North Atlantic Deep Water. This production of dense water is essential in maintaining the thermohaline circulation, and the accurate representation of these processes is important in climate modelling.
Odden
The Odden ice tongue in the Greenland Sea is an area where so-called pancake ice is the most common type of ice. Odden means headland in Norwegian. During the winter, it grows eastward from the East Greenland ice edge around 72°N to 74°N. The Jan Mayen Current brings some very cold polar surface water, which it takes from the East Greenland Current. Most of the old ice continues south, driven by the wind, so a cold open water surface is exposed on which new ice forms as frazil and pancake in the rough seas.
Changes in size and volume of sea ice


Records of Arctic Sea ice from the United Kingdom's Hadley Centre for Climate Prediction and Research go back to the turn of the 20th century. Before 1950, the data is not as good as after 1950. Reliable measurements of sea ice edge begin within the satellite era. From the late 1970s, there were different satellites that could provide data which was independent of solar illumination or weather conditions. The frequency and accuracy of passive microwave measurements improved with the launch of the DMSP F8 Special Sensor Microwave/Imager (SSMI) in 1987. Both the sea ice area and extent are estimated. The latter is lager, as it is defined as the area of ocean with at least 15% sea ice.
A modeling study of the 52-year period from 1947 to 1999 found a statistically significant decrease in Arctic ice volume of 3% per decade, caused by an increase in tempertature. A computer-based, time-resolved calculation of sea ice volume, fitted to various measurements, revealed that monitoring the ice volume is much more important for evaluating sea ice loss than pure area considerations.
The trends from 1979 to 2002 have been a statistically significant Arctic sea ice decrease of 2.5% ± 0.9% per decade during those 23 years. Climate models simulated this trend in 2002. The September minimum ice extent trend for 1979–2011 declined by 12.0% per decade during 32 years. In 2007 the minimum extent fell by more than a million square kilometers, the biggest decline since accurate satellite data has been available, to 4,140,000 km2 (1,600,000 sq mi). New research shows the Arctic Sea ice to be melting faster than predicted by any of the 18 computer models used by the Intergovernmental Panel on Climate Change in preparing its 2007 assessments. In 2012, a new record low of about 3,500,000 km2 (1,400,000 sq mi) was reached.
In the overall mass balance, the volume of sea ice depends on the thickness of the ice as well as the area covered. While the satellite era has enabled better measurement of trends in area, accurate ice thickness measurements remain a challenge. "Nonetheless, the extreme loss of this summer’s sea ice cover and the slow onset of freeze-up portends lower than normal ice extent throughout autumn and winter, and the ice that grows back is likely to be fairly thin". As more and more of the sea ice is thinner first-year ice the greater effect storms have on its stability with turbulence resulting from major extratropical cyclones resulting in extensive fractures of sea ice.
-
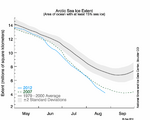
Ice extent as of August 25, 2012. Gray area indicates ± two standard deviations from 1979-2000 averages.
-
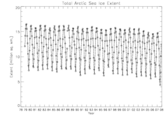
Arctic sea ice extent, 1978 to 2007
-
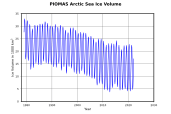
The development of Arctic sea ice volume as determined by measurement corrected numerical simulation shows probability of total sea ice loss in summer for the near future.
-
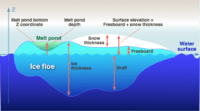
Scientific parameter to quantify the extent of sea ice.
-
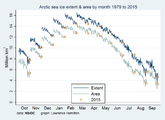
Cycle plot of Arctic sea ice area and extent by month, 1979 to 2015.


See also
 In Spanish: Casquete polar ártico para niños
