
Bushfire facts for kids


Bushfires in Australia are frequent events during the warmer months of the year, due to Australia's mostly hot, dry climate. Each year, such fires impact extensive areas. On one hand, they can cause property damage and loss of human life. On the other hand, certain native flora in Australia have evolved to rely on bushfires as a means of reproduction, and fire events are an interwoven and an essential part of the ecology of the continent. For thousands of years, Indigenous Australians have used fire to foster grasslands for hunting and to clear tracks through dense vegetation.
Major firestorms that result in severe loss of life are often named based on the day on which they occur, such as Ash Wednesday and Black Saturday. Some of the most intense, extensive and deadly bushfires commonly occur during droughts and heat waves, such as the 2009 Southern Australia heat wave, which precipitated the conditions during the 2009 Black Saturday bushfires in which 173 people lost their lives. Other major conflagrations include the 1983 Ash Wednesday bushfires, the 2003 Eastern Victorian alpine bushfires and the 2006 December Bushfires.
Global warming is increasing the frequency and severity of bushfires.
Contents
Categories
The term "bushfire" builds on the concept of "the bush", referring to sparsely-inhabited regions. Bushfires in Australia are generally defined as uncontrolled, non-structural fires burning in a grass, scrub, bush, or forested area. Australia, being a geographically and meteorogically diverse continent, experiences many types of bushfires. There are two main categories, depending on local topography.
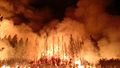
- Hilly/mountainous fires – burn in hilly, mountainous or alpine areas which are usually densely forested. The land is less accessible and not conducive to agriculture, thus many of these densely forested areas have been saved from deforestation and are protected by national, state and other parks. The steep terrain increases the speed and intensity of a firestorm. Where settlements are located in hilly or mountainous areas, bushfires can pose a threat to both life and property.
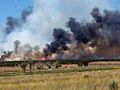
- Flat/grassland fires – burn along flat plains or areas of small undulation, predominantly covered in grasses or scrubland. These fires can move quickly, fanned by high winds in flat topography, and they quickly consume the small amounts of fuel/vegetation available. These fires pose less of a threat to settlements as they rarely reach the same intensity seen in major firestorms as the land is flat, the fires are easier to map and predict, and the terrain is more accessible for firefighting personnel. Many regions of predominantly flat terrain in Australia have been almost completely deforested for agriculture, reducing the fuel loads which would otherwise facilitate fires in these areas.
Common causes of bushfires include lightning, arcing from overhead power lines, arson, accidental ignition in the course of agricultural clearing, grinding and welding activities, campfires, cigarettes and dropped matches, sparks from machinery, and controlled burn escapes.

History


The natural fire regime in Australia was altered by the arrival of humans. Fires became more frequent, and fire-loving species—notably eucalypts—greatly expanded their range. It is assumed that a good deal of this change came about as the result of deliberate action by early humans, setting fires to clear undergrowth or drive game.
Plants have evolved a variety of strategies to survive (or even require) bushfires, (possessing epicormic shoots or lignotubers that sprout after a fire, or developing fire-resistant or fire-triggered seeds) or even encourage fire (eucalypts contain flammable oils in the leaves) as a way to eliminate competition from less fire-tolerant species.
Some native animals are also adept at surviving bushfires.
Warnings
In 2009, a standardised Fire Danger Rating (FDR) was adopted by all Australian states. During the fire season the Bureau of Meteorology (BOM) provides fire weather forecasts and by considering the predicted weather including temperature, relative humidity, wind speed and dryness of vegetation, fire agencies determine the appropriate Fire Danger Rating. In 2010, following a national review of the bush fire danger ratings, new trigger points for each rating were introduced for grassland areas in most jurisdictions. See for example the following glossary
Fire Danger Ratings are a feature of weather forecasts and alert the community to the actions they should take in preparation of the day. Ratings are broadcast via newspapers, radio, TV, and the internet.
| Category | Fire Danger Index |
|---|---|
| Catastrophic / Code Red | Forest 100+ Grass 150+ |
| Extreme | Forest 75–100 Grass 100–150 |
| Severe | Forest 50–75 Grass 50–100 |
| Very high | 25–50 |
| High | 12–25 |
| Low to moderate | 0–12 |
Regional management
The Australasian Fire Authorities Council (AFAC) is the peak body responsible for representing fire, emergency services and land management agencies in the Australasian region.
Queensland
The Rural Fire Service (RFS) is a volunteer-based firefighting agency and operates as part of the Queensland Fire and Emergency Services.
New South Wales
The New South Wales Rural Fire Service (RFS) is a volunteer-based firefighting agency and statutory body of the Government of New South Wales.
South Australia
The Country Fire Service is a volunteer based fire service in the state of South Australia. The CFS operates as a part of the South Australian Fire and Emergency Services Commission (SAFECOM).
Victoria

In Victoria, the Country Fire Authority (CFA) provides firefighting and other emergency services to country areas and regional townships within the state, as well as large portions of the outer suburban areas and growth corridors of Melbourne not covered by the Metropolitan Fire Brigade.
Western Australia
The Department of Fire and Emergency Services of Western Australia (DFES) and the Department of Parks and Wildlife (P&W) have joint responsibility for bushfire management in Western Australia. DFES is an umbrella organisation supporting the Bush Fire Brigade volunteers, Emergency Services Cadets, Fire and Rescue Service, State Emergency Service, Volunteer Emergency Service, Volunteer Fire Service, Volunteer Fire and Rescue Service, and the Volunteer Marine Rescue Services.
Guidelines for survival
Local authorities provide education and information for residents in bushfire-prone regions regarding the location of current fires, preservation of life and property and when to escape by car.
Seasonality
Bushfires in Australia can occur all year-round, though the severity and the "bushfire season" varies by region. These seasons are commonly grouped into years such as "2006-07 Australian bushfire season" and typically run from June one year until May the next year.
In southeast Australia, bushfires tend to be most common and most severe during summer and autumn (December–March), in drought years, and particularly severe in El Niño years. Southeast Australia is fire-prone, and warm and dry conditions intensify the probability of fire. In northern Australia, bushfires usually occur during the dry season (April to September), and fire severity tends to be more associated with seasonal weather patterns. In the southwest, similarly, bushfires occur in the summer dry season and severity is usually related to seasonal growth. Fire frequency in the north is difficult to assess, as the vast majority of fires are caused by human activity, however lightning strikes are as common a cause as human-ignited fires and arson.
Climate change

Australia's climate has been trending toward more bushfire weather over the last 30 years. The Climate Commission found that "The intensity and seasonality of large bushfires in south-east Australia appears to be changing, with climate change a possible contributing factor."
A 2006 report by the Bushfire CRC acknowledges the complexity of climate predictions pointing out "Much of [Australia's] vegetation has a complex evolutionary and dependent relationship with fire. Fire has been part of these environments for tens of thousands of years and much native flora and fauna remains dependent on it in various ways." In 2007, a study by the CSIRO (the national government body for scientific research in Australia), found evidence that climate change will lead to increases in very high and extreme fire danger rating days and earlier onset of the fire season. Other studies investigating the historical record identify significant changes in Australia's bushfire season as a result of human activity.
Major bushfires in Australia
Bushfires have accounted for over 800 deaths in Australia since 1851 and, in 2012, the total accumulated cost was estimated at $1.6 billion. In terms of monetary cost however, they rate behind the damage caused by drought, severe storms, hail, and cyclones, perhaps because they most commonly occur outside highly populated urban areas. However, the severe fires of the summer of 2019–2020 affected densely populated areas including holiday destinations leading NSW Rural Fire Services Commissioner, Shane Fitzsimmons, to claim it was "absolutely" the worst bushfire season on record.
Some of the most severe Australian bushfires (single fires and fire seasons), in chronological order, have included: note 2019/2020 bushfires have a combined total of hectares burned for the States names not single State totals.
| Name or description | State(s) / territories |
Area burned (approx.) |
Date | Fatalities | Properties damaged | Notes | |
|---|---|---|---|---|---|---|---|
| ha | acres | ||||||
| Black Thursday bushfires | Victoria | 5,000,000 | 12,000,000 | 6 February 1851 | about 12 | 1 million sheep; thousands of cattle | |
| Red Tuesday bushfires | Victoria | 260,000 | 640,000 | 1 February 1898 | 12 | 2,000 buildings | |
| 1926 bushfires | Victoria | February–March 1926 | 60 | 1,000 | |||
| Black Friday bushfires | Victoria | 2,000,000 | 4,900,000 | December 1938 – January 1939 | 71 | 3,700 | |
| 1944 bushfires | Victoria | 1,000,000 | 2,500,000 | 14 January – 14 February 1944 | 15–20 | more than 500 houses | |
| Woodford/Springwood Bushfire 1944, Blue Mountains | New South Wales | 18 November 1944 | Nil | 27 homes | |||
| 1951–52 bushfires | Victoria | 4,000,000 | 9,900,000 | November 1951 – January 1952 | 11 | ||
| Black Sunday bushfires | South Australia | 39,000–160,000 | 96,000–395,000 | 2 January 1955 | 2 | 40 dwellings including the Governor's summer residence at Marble Hill | |
| Grose Valley bushfire, Blue Mountains 1957 | New South Wales | 30 November 1957 | 4 | 4 boys were killed on a bush walk out to Perrys look down 5 others survived, the leader of the group got help at Blackheath | |||
| 1957 Leura bushfire, Blue Mountains | New South Wales | 2 December 1957 | Nil | 170 homes in parts of Katoomba, Leura and Wentworth falls | One building that was destroyed was the Chateau Napier. | ||
| 1961 Western Australian bushfires | Western Australia | 1,800,000 | 4,400,000 | January–March 1961 | Nil | 160 homes | |
| 1962 bushfires | Victoria | 14–16 January 1962 | 32 | 450 houses | |||
| 1965 Gippsland bushfires | Victoria | 315,000 | 780,000 | 21 Feb – 13 March 1965 | Nil | 60 buildings, 4000 stock | |
| Southern Highlands bushfires | New South Wales | 5–14 March 1965 | 3 | 59 homes | |||
| Tasmanian "Black Tuesday" bushfires | Tasmania | 264,000 | 650,000 | 7 February 1967 | 62 | 1,293 homes | |
| Dandenong Ranges bushfire | Victoria | 1,920 | 4,700 | 19 February 1968 | 53 homes; 10 other buildings | ||
| 1968 Blue Mountains Bushfire | New South Wales | 29 November 1968 | 4 | over 120 homes | |||
| 1969 bushfires | Victoria | 8 January 1969 | 23 | 230 houses | |||
| 1974 Moolah-Corinya bushfires, Far West NSW | New South Wales | 1,117,000 | 2,760,000 | Mid-December 1974 | 3 | 40 homes, 10,170 kilometres (6,320 mi) of fencing, 50,000 livestock | |
| 1974 Cobar bushfire | New South Wales | 1,500,000 | 3,700,000 | Mid-December 1974 | |||
| 1974 Balranald bushfire | New South Wales | 340,000 | 840,000 | Mid December 1974 | |||
| 1974–75 New South Wales bushfires | New South Wales | 4,500,000 | 11,000,000 | 1974–1975 season | 6 | ||
| 1974–1975 Northern Territory bushfires | Northern Territory | 45,000,000 | 110,000,000 | 1974–1975 season | |||
| 1974–1975 Queensland bushfires | Queensland | 7,500,000 | 19,000,000 | 1974–1975 season | |||
| 1974–1975 South Australia bushfires | South Australia | 17,000,000 | 42,000,000 | 1974–1975 season | |||
| 1974–1975 Western Australia bushfires | Western Australia | 29,000,000 | 72,000,000 | 1974–1975 season | |||
| Western Districts bushfires | Victoria | 103,000 | 250,000 | 12 February 1977 | 4 | 116 houses, 340 buildings | |
| Blue Mountains Fires 1977 | New South Wales | 54,000 | 130,000 | 17 December 1977 | 2 | 49 houses | |
| 1978 Western Australian bushfires | Western Australia | 114,000 | 280,000 | 4 April 1978 | 2 | 6 buildings (drop in wind in early evening is said to have saved the towns of Donnybrook, Boyup Brook, Manjimup, and Bridgetown.) | |
| 1979 Sydney bushfires | New South Wales | December 1979 | 5 | 28 homes destroyed, 20 homes damaged | |||
| 1980 Waterfall bushfire | New South Wales | 1,000,000 | 2,500,000 | 3 November 1980 | 5 firefighters | 14 homes | |
| Grays Point bushfire | New South Wales | 9 January 1983 | 3 volunteer firefighters | ||||
| Ash Wednesday bushfires |
|
418,000 | 1,030,000 | 16 February 1983 | 75 | about 2,400 houses | |
| 1984 Western New South Wales grasslands bushfires | New South Wales | 500,000 | 1,200,000 | 25 December 1984 | 40,000 livestock, $40 million damage | ||
| 1985 Cobar bushfire | New South Wales | 516,000 | 1,280,000 | Mid January 1985 | Nil | ||
| 1984/85 New South Wales bushfires | New South Wales | 3,500,000 | 8,600,000 | 1984–1985 season | 5 | ||
| Central Victoria bushfires | Victoria | 50,800 | 126,000 | 14 January 1985 | 3 | 180+ houses | |
| 1994 Eastern seaboard fires | New South Wales | 400,000 | 990,000 | 27 December 1993 – 16 January 1994 | 4 | 225 homes | |
| Wooroloo bushfire | Western Australia | 10,500 | 26,000 | 8 January 1997 | Nil | 16 homes | |
| Dandenongs bushfire | Victoria | 400 | 990 | 21 January 1997 | 3 | 41 homes | |
| Lithgow bushfire | New South Wales | 2 December 1997 | 2 firefighters | ||||
| Menai bushfire | New South Wales | 2 December 1997 | 1 firefighter | 11 homes destroyed, 30 homes damaged | |||
| Perth and SW Region bushfires | Western Australia | 23,000 | 57,000 | 2 December 1997 | 2 | 1 home lost | |
| Linton bushfire | Victoria | 2 December 1998 | 5 | ||||
| Black Christmas bushfires | New South Wales | 300,000 | 740,000 | 25 December 2001 – 2002 | Nil | 121 homes | |
| 2002 NT bushfires | Northern Territory | 15,000,000 | 37,000,000 | August–November 2002 | |||
| 2003 Canberra bushfires | Australian Capital Territory | 160,000 | 400,000 | 18–22 January 2003 | 4 | almost 500 homes | |
| 2003 Eastern Victorian alpine bushfires | Victoria | 1,300,000 | 3,200,000 | 8 January – 8 March 2003 | 3 | 41 homes | |
| Tenterden | Western Australia | 2,110,000 | 5,200,000 | December 2003 | 2 | ||
| 2005 Eyre Peninsula bushfire | South Australia | 77,964 | 192,650 | 10–12 January 2005 | 9 | 93 homes | |
| 2006 Central Coast bushfire | New South Wales | New Years Day, 2006 | |||||
| Jail Break Inn Fire, Junee | New South Wales | 30,000 | 74,000 | New Years Day 2006 | Nil | Livestock losses estimated to be over 20,000. Seven homes, seven headers and four shearing sheds destroyed. 1,500 kilometres (930 mi) of fencing damaged. | |
| 2005 Victorian bushfires | Victoria | 160,000 | 400,000 | December 2005 – January 2006 | 4 | 57 houses, 359 farm buildings, 65,000 stock losses, fires occurred in the Stawell, Moondarra, Anakie, Yea, and Kinglake regions. | |
| Grampians bushfire | Victoria | 184,000 | 450,000 | January 2006 | 2 | ||
| Pulletop bushfire, Wagga Wagga | New South Wales | 9,000 | 22,000 | 6 February 2006 | Nil | 2,500 sheep and 6 cattle killed, 3 vehicles and 2 hay sheds destroyed as well as 50 kilometres (31 mi) of fencing. | |
| The Great Divides bushfire | Victoria | 1,048,000 | 2,590,000 | 1 December 2006 – March 2007 | 1 | 51 homes | |
| 2006–07 Australian bushfire season |
|
1,360,000 | 3,400,000 | September 2006 – January 2007 | 5 | Over 100 structures including 83 houses; numerous non-residential structures | |
| Dwellingup bushfire | Western Australia | 12,000 | 30,000 | 4 February 2007 | Nil | 16 | |
| Kangaroo Island bushfires | South Australia | 95,000 | 230,000 | 6–14 December 2007 | 1 | ||
| Boorabbin National Park | Western Australia | 40,000 | 99,000 | 30 December 2007 | 3 | Powerlines and Great Eastern Highway, forced to close for 2 weeks. | |
| Black Saturday bushfires | Victoria | 450,000 | 1,100,000 | 7 February 2009 – 14 March 2009 | 173 | 2,029+ houses, 2,000 other structures. | |
| Toodyay bushfire | Western Australia | 3,000 | 7,400 | 29 December 2009 | Nil | 38 | |
| Lake Clifton bushfire | Western Australia | 2,000 | 4,900 | 11 January 2011 | Nil | 10 homes destroyed. | |
| Roleystone Kelmscott bushfire | Western Australia | 1,500 | 3,700 | 6–8 February 2011 | Nil | 72 homes destroyed, 32 damaged, Buckingham Bridge on Brookton Highway collapsed and closed for 3 weeks whilst a temporary bridge was constructed and opened a month after the fires. | |
| Margaret River bushfire | Western Australia | 4,000 | 9,900 | 24 November 2011 | Nil | 34 homes destroyed including the historic Wallcliffe House. | |
| Tasmanian bushfires | Tasmania | 20,000 | 49,000 | 4 January 2013 | 1 | At least 170 buildings | |
| Warrumbungle bushfire | New South Wales | 54,000 | 130,000 | 18 January 2013 | Nil | At least 53 homes, 118 sheds, agricultural machinery and livestock. Infrastructure destroyed at Siding Spring Observatory. | |
| 2013 New South Wales bushfires | New South Wales | 100,000 | 250,000 | 17–28 October 2013 | 1 | As of 19 October 2013[update] at least 248 buildings destroyed statewide (inc. 208 dwellings), another 109 damaged in Springwood, Winmalee and Yellow Rock. Major fires also occurred in the Hunter, Central Coast, Macarthur and Port Stephens regions causing significant damage. | |
| Carnarvon bushfire complex | Western Australia | 800,000 | 2,000,000 | 27 December 2011 – 3 February 2012 | Nil | 11 pastoral stations (fences, watering systems, water points, stock feed). | |
| 2014 Parkerville bushfire | Western Australia | 386 | 950 | 12 January 2014 | Nil | 56 homes. | |
| 2015 Sampson Flat bushfires | South Australia | 20,000 | 49,000 | 2–9 January 2015 | Nil | 27 homes, 140 outbuildings | |
| 2015 O'Sullivan bushfire (Northcliffe – Windy Harbour) | Western Australia | 98,923 | 244,440 | 29 January – 20 February 2015 | Nil | 1 home and 1 inhabited shed, 5 farm sheds and thousands of hectares of production forests (karri and jarrah) or national parks. | |
| 2015 Lower Hotham bushfire (Boddington) | Western Australia | 52,373 | 129,420 | January 2015 | Nil | 1 house, 1 farm shed, 1 bridge and thousands of hectares of production forest (jarrah) or national parks. | |
| 2015 Esperance bushfires | Western Australia | 200,000 | 490,000 | October–November 2015 | 4 | About 10 houses and public buildings (Scaddan), 15,000 stock losses, 5 Nature Reserves et most area of Cape Arid national park. | |
| Perth Hills bushfire complex – Solus Group | Western Australia | 10,016 | 24,750 | 15–24 November 2015 | Nil | Jarrah production forest and Conservation Park. | |
| 2015 Pinery bushfire | South Australia | 85,000 | 210,000 | 25 November – 2 December 2015 | 2 | 91 dwellings. | |
| 2016 Murray Road bushfire (Waroona and Harvey) | Western Australia | 69,165 | 170,910 | January 2016 | 2 | 181 dwellings (166 only in Yarloop), historical Yarloop Workshops and thousands of hectares of Lane Poole Reserve and production forest (jarrah). | |
| 2017 New South Wales bushfires | New South Wales | 52,000 | 130,000 | 11–14 February 2017 | Nil | 35 dwellings. | |
| 2017 Carwoola bushfire | New South Wales | 3,500 | 8,600 | 17–18 February 2017 | Nil | 11 dwellings destroyed; 12 damaged. | |
| 2018 Tathra bushfire | New South Wales | 1,200 | 3,000 | 18–19 March 2018 | Nil | 69 houses and 30 caravans/cabins destroyed; 39 damaged. | |
| Tabulam bushfire | New South Wales | 4,000 | 9,900 | early February 2019 | Nil | 10 homes and 23 outbuildings destroyed. | |
| Tingha bushfire | New South Wales | 17,000 | 42,000 | early February 2019 | Nil | 8 homes and 18 outbuildings destroyed. | |
| 2019–20 Australian bushfire season |
|
18,626,000 | 46,030,000 | 5 September 2019 – February 2020 | 33 (including 3 NSW firefighters, 1 VIC firefighter and 3 US firefighters who were killed in a Lockheed C-130 Hercules Water Bomber crash in the Snowy Monaro region) | 2600+ homes currently confirmed destroyed (as of 13 January 2020)
|
Area Other At least 1,000,000,000 wild animals are estimated to have died (not including frogs and insects) with some species thought to be facing extinction. |
Related pages
Images for kids
-
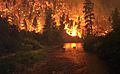
Wildfire near Yosemite National Park, United States, in 2013. The Rim Fire burned more than 250,000 acres (1,000 km2) of forest.
-
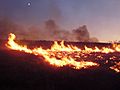
A surface fire in the western desert of Utah, United States
-
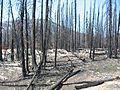
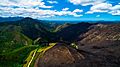
Charred landscape following a crown fire in the North Cascades, United States
-
Experimental fire in Canada
-
A dirt road acted as a fire barrier in South Africa. The effects of the barrier can clearly be seen on the unburnt (left) and burnt (right) sides of the road.
-
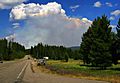
Lightning-sparked wildfires are frequent occurrences during the dry summer season in Nevada.
-
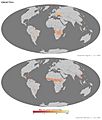
Global fires during the year 2008 for the months of August (top image) and February (bottom image), as detected by the Moderate Resolution Imaging Spectroradiometer (MODIS) on NASA's Terra satellite.
-
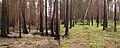
Ecological succession after a wildfire in a boreal pine forest next to Hara Bog, Lahemaa National Park, Estonia. The pictures were taken one and two years after the fire.
-
A Pyrocumulus cloud produced by a wildfire in Yellowstone National Park
-
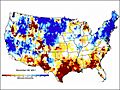
National map of groundwater and soil moisture in the United States. It shows the very low soil moisture associated with the 2011 fire season in Texas.
-
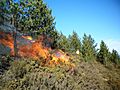
A prescribed burn in a Pinus nigra stand in Portugal
-
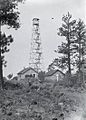
Dry Mountain Fire Lookout in the Ochoco National Forest, Oregon, circa 1930
-
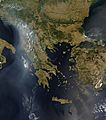
Wildfires across the Balkans in late July 2007 (MODIS image)
-
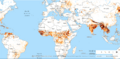
Global map of fire alerts on April 13, 2021. Available from Global Forest Watch. Live updates.
-
A Russian firefighter extinguishing a wildfire
-
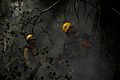
Wildfire fighters cutting down a tree using a chainsaw
-
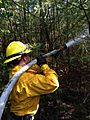
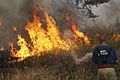
Wildland firefighter working a brush fire in Hopkinton, New Hampshire
-
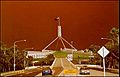
2003 Canberra firestorm
-
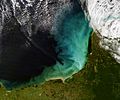
Sediment off the Yucatan Peninsula
-
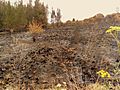
Charred shrubland in suburban Sydney (2019–20 Australian bushfires).
-
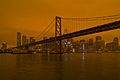
Smoke from the 2020 California wildfires settles over San Francisco
-
Elk Bath, an award winning photograph of elk avoiding a wildfire in Montana
-
Aerial view of deliberate wildfires on the Khun Tan Range, Thailand. These fires are lit by local farmers every year to promote the growth of a certain mushroom


.jpg)


See also
 In Spanish: Incendio forestal para niños
