South Carolina has a humid subtropical climate, with hot summers throughout most of the State. But, an exception does occur in the Blue Ridge Mountains, as outlier pockets of an Oceanic Climate do exist. Mild winters predominate in the eastern and southern part of the state, but cool to occasionally cold winters are the standard in the northwestern area of the state, especially areas at or above 600 feet in elevation. On average, between 40 and 80 inches (1,000 and 2,000 mm) of precipitation falls annually across the state, potentially even in excess of 100 inches in portions of the Appalachian temperate rainforest. Tropical cyclones, and afternoon thunderstorms due to hot and humid conditions, contribute to precipitation during the summer and sometimes fall months, while extratropical cyclones contribute to precipitation during the fall, winter, and spring months. The coast experiences nearly all of their tropical weather impacts from storms coming directly from the Atlantic coast. The northwestern area of the state can receive impacts from both Atlantic basin storms moving westward from the coast and also occasionally very heavy rainfall and flooding from storms originating from the Gulf of Mexico that move inland towards the northeast after making landfall from the Florida Panhandle to Louisiana.
Tornadoes happen mostly in the spring, with a secondary peak in November. Hail and damaging winds often occur in summertime thunderstorms. Tornadoes are very uncommon in the summer unless a tropical disturbance were to spawn one.
Temperatures
South Carolina has a humid subtropical climate (Köppen climate classification Cfa), although high elevation areas in the "Upstate" area have less subtropical characteristics than areas on the Atlantic coastline. In the summer, South Carolina is hot and humid with temperatures during the day averaging near 90 °F (32 °C) across most of the state with overnight lows near 90 °F (32 °C). Winter temperatures are much less uniform. Coastal areas of the state have very mild winters with high temperatures averaging about 60 °F (16 °C) and overnight lows close to 38 °F (3 °C). Further inland in the Piedmont, temperatures average between 50 °F (10 °C) during the day and 32 °F (0 °C) at night.
| Monthly normals and extremes for various South Carolina cities |
|
Greenville
| Climate data for Greenville, South Carolina (Greenville–Spartanburg Int'l), 1981–2010 normals, extremes 1884–present |
| Month |
Jan |
Feb |
Mar |
Apr |
May |
Jun |
Jul |
Aug |
Sep |
Oct |
Nov |
Dec |
Year |
| Record high °F (°C) |
82
(28) |
81
(27) |
91
(33) |
94
(34) |
100
(38) |
105
(41) |
107
(42) |
105
(41) |
101
(38) |
97
(36) |
86
(30) |
79
(26) |
107
(42) |
| Mean maximum °F (°C) |
69.4
(20.8) |
72.5
(22.5) |
80.8
(27.1) |
86.0
(30.0) |
90.2
(32.3) |
95.1
(35.1) |
97.3
(36.3) |
95.9
(35.5) |
91.1
(32.8) |
84.4
(29.1) |
77.1
(25.1) |
69.5
(20.8) |
98.6
(37.0) |
| Average high °F (°C) |
52.4
(11.3) |
56.6
(13.7) |
64.5
(18.1) |
72.8
(22.7) |
80.2
(26.8) |
87.5
(30.8) |
90.3
(32.4) |
88.6
(31.4) |
82.2
(27.9) |
72.8
(22.7) |
63.5
(17.5) |
54.1
(12.3) |
72.1
(22.3) |
| Average low °F (°C) |
32.0
(0.0) |
34.9
(1.6) |
41.2
(5.1) |
48.3
(9.1) |
57.2
(14.0) |
65.8
(18.8) |
69.4
(20.8) |
68.7
(20.4) |
61.8
(16.6) |
50.4
(10.2) |
41.3
(5.2) |
34.0
(1.1) |
50.4
(10.2) |
| Mean minimum °F (°C) |
14.6
(−9.7) |
19.0
(−7.2) |
24.2
(−4.3) |
32.6
(0.3) |
42.7
(5.9) |
55.0
(12.8) |
61.7
(16.5) |
60.7
(15.9) |
47.9
(8.8) |
34.1
(1.2) |
26.0
(−3.3) |
18.1
(−7.7) |
11.8
(−11.2) |
| Record low °F (°C) |
−6
(−21) |
−5
(−21) |
11
(−12) |
22
(−6) |
27
(−3) |
40
(4) |
53
(12) |
50
(10) |
32
(0) |
25
(−4) |
11
(−12) |
3
(−16) |
−6
(−21) |
| Average precipitation inches (mm) |
3.82
(97) |
3.97
(101) |
4.52
(115) |
3.36
(85) |
3.76
(96) |
3.80
(97) |
4.80
(122) |
4.48
(114) |
3.43
(87) |
3.44
(87) |
3.70
(94) |
4.11
(104) |
47.19
(1,199) |
| Average snowfall inches (cm) |
2.3
(5.8) |
1.0
(2.5) |
0.9
(2.3) |
trace |
0
(0) |
0
(0) |
0
(0) |
0
(0) |
0
(0) |
0
(0) |
0.1
(0.25) |
0.4
(1.0) |
4.7
(12) |
| Average precipitation days (≥ 0.01 in) |
10.2 |
9.2 |
9.6 |
9.0 |
9.7 |
10.4 |
11.7 |
10.4 |
8.1 |
7.2 |
8.9 |
9.8 |
114.2 |
| Average snowy days (≥ 0.1 in) |
1.2 |
0.7 |
0.3 |
0.1 |
0 |
0 |
0 |
0 |
0 |
0 |
0.1 |
0.4 |
2.8 |
| Average relative humidity (%) |
65.8 |
62.6 |
62.1 |
60.7 |
68.5 |
70.5 |
74.0 |
75.6 |
75.8 |
70.9 |
68.2 |
67.7 |
68.5 |
| Mean monthly sunshine hours |
176.6 |
182.7 |
236.2 |
264.7 |
269.2 |
270.8 |
267.8 |
253.9 |
229.2 |
235.2 |
184.3 |
169.4 |
2,740 |
| Percent possible sunshine |
56 |
60 |
64 |
68 |
62 |
62 |
61 |
61 |
62 |
67 |
59 |
55 |
62 |
| Source: NOAA (relative humidity 1962–1990, sun 1961–1990) |
|
Columbia
| Climate data for Columbia, South Carolina (Columbia Airport), 1981–2010 normals, extremes 1887–present |
| Month |
Jan |
Feb |
Mar |
Apr |
May |
Jun |
Jul |
Aug |
Sep |
Oct |
Nov |
Dec |
Year |
| Record high °F (°C) |
84
(29) |
84
(29) |
93
(34) |
96
(36) |
101
(38) |
109
(43) |
107
(42) |
107
(42) |
106
(41) |
101
(38) |
90
(32) |
83
(28) |
109
(43) |
| Mean maximum °F (°C) |
73.7
(23.2) |
77.6
(25.3) |
83.9
(28.8) |
89.3
(31.8) |
94.0
(34.4) |
98.5
(36.9) |
100.2
(37.9) |
98.9
(37.2) |
94.5
(34.7) |
88.2
(31.2) |
80.9
(27.2) |
75.3
(24.1) |
101.6
(38.7) |
| Average high °F (°C) |
56.0
(13.3) |
60.3
(15.7) |
68.2
(20.1) |
76.3
(24.6) |
83.8
(28.8) |
90.0
(32.2) |
92.7
(33.7) |
90.7
(32.6) |
85.2
(29.6) |
76.1
(24.5) |
67.3
(19.6) |
58.2
(14.6) |
75.4
(24.1) |
| Average low °F (°C) |
33.7
(0.9) |
36.8
(2.7) |
43.0
(6.1) |
50.4
(10.2) |
59.5
(15.3) |
68.2
(20.1) |
71.6
(22.0) |
71.0
(21.7) |
64.2
(17.9) |
52.1
(11.2) |
42.3
(5.7) |
35.3
(1.8) |
52.3
(11.3) |
| Mean minimum °F (°C) |
16.4
(−8.7) |
20.6
(−6.3) |
25.5
(−3.6) |
33.2
(0.7) |
44.1
(6.7) |
56.6
(13.7) |
63.5
(17.5) |
62.0
(16.7) |
49.0
(9.4) |
34.4
(1.3) |
26.2
(−3.2) |
19.1
(−7.2) |
14.7
(−9.6) |
| Record low °F (°C) |
−1
(−18) |
−2
(−19) |
4
(−16) |
26
(−3) |
34
(1) |
44
(7) |
54
(12) |
53
(12) |
40
(4) |
23
(−5) |
12
(−11) |
4
(−16) |
−2
(−19) |
| Average precipitation inches (mm) |
3.58
(91) |
3.61
(92) |
3.73
(95) |
2.62
(67) |
2.97
(75) |
4.69
(119) |
5.46
(139) |
5.26
(134) |
3.54
(90) |
3.17
(81) |
2.74
(70) |
3.22
(82) |
44.59
(1,133) |
| Average snowfall inches (cm) |
0.8
(2.0) |
0.5
(1.3) |
0.1
(0.25) |
0
(0) |
0
(0) |
0
(0) |
0
(0) |
0
(0) |
0
(0) |
0
(0) |
0
(0) |
0.1
(0.25) |
1.5
(3.8) |
| Average precipitation days (≥ 0.01 in) |
9.9 |
9.1 |
8.6 |
8.0 |
7.7 |
10.5 |
11.8 |
10.5 |
7.3 |
7.0 |
7.3 |
9.0 |
106.7 |
| Average snowy days (≥ 0.1 in) |
0.5 |
0.3 |
0.1 |
0 |
0 |
0 |
0 |
0 |
0 |
0 |
0 |
0.1 |
1.0 |
| Average relative humidity (%) |
69.2 |
65.8 |
64.6 |
62.1 |
68.2 |
70.8 |
73.4 |
76.5 |
75.9 |
73.0 |
71.6 |
70.7 |
70.2 |
| Mean monthly sunshine hours |
172.7 |
180.7 |
237.3 |
269.6 |
292.9 |
280.0 |
286.0 |
263.3 |
239.8 |
235.0 |
193.8 |
175.0 |
2,826.1 |
| Percent possible sunshine |
55 |
59 |
64 |
69 |
68 |
65 |
65 |
63 |
64 |
67 |
62 |
57 |
64 |
| Source: NOAA (relative humidity and sun 1961−1990) |
|
Charleston
| Climate data for Charleston Int'l, South Carolina (1981–2010 normals, extremes 1938–present) |
| Month |
Jan |
Feb |
Mar |
Apr |
May |
Jun |
Jul |
Aug |
Sep |
Oct |
Nov |
Dec |
Year |
| Record high °F (°C) |
83
(28) |
87
(31) |
90
(32) |
95
(35) |
99
(37) |
103
(39) |
104
(40) |
105
(41) |
99
(37) |
94
(34) |
88
(31) |
83
(28) |
105
(41) |
| Mean maximum °F (°C) |
75.3
(24.1) |
78.1
(25.6) |
83.5
(28.6) |
88.5
(31.4) |
92.7
(33.7) |
96.8
(36.0) |
98.0
(36.7) |
96.5
(35.8) |
92.6
(33.7) |
87.1
(30.6) |
81.9
(27.7) |
76.8
(24.9) |
99.2
(37.3) |
| Average high °F (°C) |
59.0
(15.0) |
62.8
(17.1) |
69.6
(20.9) |
76.4
(24.7) |
83.2
(28.4) |
88.4
(31.3) |
91.1
(32.8) |
89.5
(31.9) |
84.8
(29.3) |
77.1
(25.1) |
69.8
(21.0) |
61.6
(16.4) |
76.1
(24.5) |
| Average low °F (°C) |
37.5
(3.1) |
40.6
(4.8) |
46.7
(8.2) |
53.3
(11.8) |
61.8
(16.6) |
69.6
(20.9) |
73.0
(22.8) |
72.3
(22.4) |
67.2
(19.6) |
56.8
(13.8) |
47.5
(8.6) |
40.1
(4.5) |
55.5
(13.1) |
| Mean minimum °F (°C) |
21.4
(−5.9) |
25.5
(−3.6) |
30.4
(−0.9) |
38.6
(3.7) |
49.5
(9.7) |
61.1
(16.2) |
67.5
(19.7) |
66.0
(18.9) |
55.6
(13.1) |
41.0
(5.0) |
32.6
(0.3) |
24.0
(−4.4) |
18.8
(−7.3) |
| Record low °F (°C) |
6
(−14) |
12
(−11) |
15
(−9) |
29
(−2) |
36
(2) |
50
(10) |
58
(14) |
56
(13) |
42
(6) |
27
(−3) |
15
(−9) |
8
(−13) |
6
(−14) |
| Average precipitation inches (mm) |
3.71
(94) |
2.96
(75) |
3.71
(94) |
2.91
(74) |
3.02
(77) |
5.65
(144) |
6.53
(166) |
7.15
(182) |
6.10
(155) |
3.75
(95) |
2.43
(62) |
3.11
(79) |
51.03
(1,296) |
| Average snowfall inches (cm) |
trace |
0.2
(0.51) |
0
(0) |
0
(0) |
0
(0) |
0
(0) |
0
(0) |
0
(0) |
0
(0) |
0
(0) |
0
(0) |
0.3
(0.76) |
0.5
(1.3) |
| Average precipitation days (≥ 0.01 in) |
9.6 |
8.6 |
7.9 |
7.7 |
7.8 |
11.9 |
13.0 |
13.2 |
10.0 |
7.3 |
7.0 |
8.7 |
112.7 |
| Average snowy days (≥ 0.1 in) |
0.1 |
0.2 |
0 |
0 |
0 |
0 |
0 |
0 |
0 |
0 |
0 |
0.2 |
0.5 |
| Average relative humidity (%) |
69.8 |
67.4 |
68.1 |
67.5 |
72.5 |
75.1 |
76.6 |
78.9 |
78.2 |
74.1 |
72.7 |
71.6 |
72.7 |
| Mean monthly sunshine hours |
179.3 |
186.7 |
243.9 |
275.1 |
294.8 |
279.5 |
287.8 |
256.7 |
219.7 |
224.5 |
189.5 |
171.3 |
2,808.8 |
| Percent possible sunshine |
56 |
61 |
66 |
71 |
69 |
65 |
66 |
62 |
59 |
64 |
60 |
55 |
63 |
| Source: NOAA (relative humidity and sun 1961–1990) |
| Climate data for Charleston, South Carolina (Downtown), 1981–2010 normals, extremes 1893–present |
| Month |
Jan |
Feb |
Mar |
Apr |
May |
Jun |
Jul |
Aug |
Sep |
Oct |
Nov |
Dec |
Year |
| Record high °F (°C) |
82
(28) |
83
(28) |
94
(34) |
94
(34) |
99
(37) |
104
(40) |
103
(39) |
103
(39) |
100
(38) |
95
(35) |
87
(31) |
81
(27) |
104
(40) |
| Mean maximum °F (°C) |
71.3
(21.8) |
74.6
(23.7) |
79.7
(26.5) |
84.6
(29.2) |
90.0
(32.2) |
94.0
(34.4) |
96.2
(35.7) |
94.2
(34.6) |
91.2
(32.9) |
85.2
(29.6) |
79.0
(26.1) |
73.9
(23.3) |
97.4
(36.3) |
| Average high °F (°C) |
56.7
(13.7) |
59.6
(15.3) |
65.0
(18.3) |
72.0
(22.2) |
78.7
(25.9) |
84.5
(29.2) |
87.6
(30.9) |
86.4
(30.2) |
82.0
(27.8) |
74.6
(23.7) |
67.3
(19.6) |
59.5
(15.3) |
72.8
(22.7) |
| Average low °F (°C) |
42.8
(6.0) |
45.5
(7.5) |
51.6
(10.9) |
58.8
(14.9) |
67.1
(19.5) |
74.0
(23.3) |
76.9
(24.9) |
76.1
(24.5) |
71.8
(22.1) |
62.5
(16.9) |
53.6
(12.0) |
45.6
(7.6) |
60.5
(15.8) |
| Mean minimum °F (°C) |
27.5
(−2.5) |
31.6
(−0.2) |
36.4
(2.4) |
44.8
(7.1) |
55.6
(13.1) |
66.5
(19.2) |
71.0
(21.7) |
69.8
(21.0) |
61.6
(16.4) |
48.1
(8.9) |
39.1
(3.9) |
30.2
(−1.0) |
24.8
(−4.0) |
| Record low °F (°C) |
10
(−12) |
7
(−14) |
22
(−6) |
36
(2) |
45
(7) |
52
(11) |
61
(16) |
59
(15) |
50
(10) |
37
(3) |
17
(−8) |
12
(−11) |
7
(−14) |
| Average precipitation inches (mm) |
2.94
(75) |
2.51
(64) |
3.30
(84) |
2.53
(64) |
2.16
(55) |
4.65
(118) |
5.40
(137) |
6.71
(170) |
5.76
(146) |
3.67
(93) |
2.19
(56) |
2.60
(66) |
44.42
(1,128) |
| Average precipitation days (≥ 0.01 in) |
9.0 |
8.0 |
7.8 |
6.9 |
6.6 |
10.0 |
11.3 |
11.3 |
8.9 |
6.6 |
6.3 |
8.6 |
101.3 |
| Source: NOAA |
|
Precipitation

Annual average precipitation in South Carolina
While precipitation is abundant the entire year in almost the entire state, the coastline tends to have a slightly wetter summer, while inland March tends to be the wettest month. During the cold season, extratropical cyclones is the main cause of precipitation, while during the summer, tropical cyclones and thunderstorms forming due to afternoon heating are the main causes of precipitation. A lee side rain shadow from the Appalachian Mountains lowers annual precipitation across central portions of the state. Inland sections average 40 inches (1,000 mm) to 50 inches (1,300 mm) of rainfall, while near the coast 50 inches (1,300 mm) to 60 inches (1,500 mm), and the Piedmont receives 70 inches (1,800 mm) to 80 inches (2,000 mm) of precipitation. Winter precipitation is determined in large by the El Niño-Southern Oscillation. During El Niño events, the jet stream is further south and east across the U.S., thus leading to cooler and wetter winters in South Carolina, while La Niña keeps the jet stream further north and west causing warmer and drier winters.
Snowfall and ice
Annual snowfall across inland South Carolina is very small, and in coastal areas several years might pass without any measurable snowfall. The snowiest location in the state averages 12 inches (30 cm) of snow a year in the Blue Ridge Mountains of the state. Freezing rain is more common than snow and even rain across much of the state in the winter months. Along the coast snowfall is very rare, with only a few snow events on record. Charleston averages less than 1 inch annually, and often 5 to 10 years might pass without any snowfall.
Tropical cyclones
The state is prone to tropical cyclones. This is an annual concern during hurricane season, which is from June through November. The peak time of vulnerability for the southeast Atlantic coast is from early August to early October when tropical cyclone frequency is highest. Major hurricanes can impact the Palmetto state, though there are no category 5 impacts on record. Two of the stronger hurricanes to strike South Carolina in recent times are Hurricane Hazel (1954) and Hurricane Hugo (1989), which were of category 4 strength. For weaker systems, rainfall and spin-up tornadoes in the outer bands are the main impacts to the state. The wettest known tropical cyclone to impact South Carolina was a tropical depression named Jerry in 1995 which stalled nearby and had previously been a tropical storm across Florida.
Thunderstorms and tornadoes
South Carolina averages around 64 days of thunderstorm activity per year. Most thunderstorms occur during the summer. South Carolina is vulnerable to tornadoes. Some notable tornadoes have struck South Carolina and the state averages around 14 tornadoes annually. There have been no F-5 tornadoes on record but over a dozen F-4 tornadoes have occurred in many counties in South Carolina.
Images for kids
-
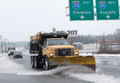
SCDOT Snow Plow in Columbia, February 2014
-
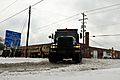
The SC Army National Guard assists in de-icing during Winter Storm Pax, 2014