
Demographics of South Carolina facts for kids

The U.S. state of South Carolina is the 23rd largest state by population, with a population of 5,024,369 according to 2017 United States Census estimates.
Historical demographics
Beginning in 1790, the United States Census Bureau collected the population statistics of South Carolina. The years listed prior to that are estimates and exclude the Native American population. From 1790 until 1860, the designated demographic classifications were white, black slave and free black.
Following the Civil War, the racial groupings were white, black and other.
The following is a list of census data for the state of South Carolina:
| Census Year |
Demographic | Population | % of Pop. | % Growth |
|---|---|---|---|---|
| 1670 | White | 140 | 90.3% | – |
| Slave | 15 | 9.7% | – | |
| Total | 155 | 100% | - | |
| 1680 | White | 1,000 | 83.3% | +614.3% |
| Slave | 200 | 16.7% | +1233.3% | |
| Total | 1,200 | 100% | +674.2% | |
| 1700 | White | 3,100 | 56.4% | +210.0% |
| Slave | 2,400 | 43.6% | +1100.0% | |
| Total | 5,500 | 100% | +358.3% | |
| 1708 | White | 4,080 | 42.6% | +31.6% |
| Black Slaves | 4,100 | 42.8% | – | |
| Indian Slaves | 1,400 | 14.6% | – | |
| Total | 9,580 | 100% | +74.2% | |
| 1720 | White | 6,500 | 35.1% | +59.3% |
| Slave | 12,000 | 64.9% | +118.2% | |
| Total | 18,500 | 100% | +93.1% | |
| 1730 | White | 10,000 | 33.3% | +53.9% |
| Slave | 20,000 | 66.7% | +66.7% | |
| Total | 30,000 | 100% | +62.2% | |
| 1740 | White | 20,000 | 33.3% | +100.0% |
| Slave | 40,000 | 66.7% | +100.0% | |
| Total | 60,000 | 100% | +100.0% | |
| 1750 | White | 21,667 | 33.3% | +8.3% |
| Slave | 43,333 | 66.7% | +8.3% | |
| Total | 65,000 | 100% | +8.3% | |
| 1760 | White | 32,000 | 38.1% | +47.7% |
| Slave | 52,000 | 61.9% | +20.0% | |
| Total | 84,000 | 100% | +29.2% | |
| 1770 | White | 50,000 | 38.5% | +56.3% |
| Slave | 80,000 | 61.5% | +53.9% | |
| Total | 130,000 | 100% | +54.7% | |
| 1780 | White | 83,000 | 46.1% | +66.0% |
| Slave | 97,000 | 53.9% | +21.3% | |
| Total | 180,000 | 100% | +38.5% | |
| 1790 | White | 140,178 | 56.3% | +68.9% |
| Slave | 107,094 | 43.0% | +10.4% | |
| Free Black | 1,801 | 0.7% | – | |
| Total | 249,073 | 100% | +38.4% | |
| 1800 | White | 196,255 | 56.8% | +40.0% |
| Slave | 146,151 | 42.3% | +36.5% | |
| Free Black | 3,185 | 0.9% | +76.9% | |
| Total | 345,591 | 100% | +38.8% | |
| 1810 | White | 214,196 | 51.6% | +9.1% |
| Slave | 196,365 | 47.3% | +34.4% | |
| Free Black | 4,554 | 1.1% | +42.9% | |
| Total | 415,115 | 100% | +20.1% | |
| 1820 | White | 237,440 | 47.2% | +10.9% |
| Slave | 258,475 | 51.4% | +31.6% | |
| Free Black | 6,826 | 1.4% | +49.9% | |
| Total | 502,741 | 100% | +21.1% | |
| 1830 | White | 257,863 | 44.4% | +8.6% |
| Slave | 323,322 | 55.6% | +25.1% | |
| Total | 581,185 | 100% | +15.6% | |
| 1840 | White | 259,084 | 43.6% | +0.5% |
| Slave | 327,038 | 55.0% | +1.2% | |
| Free Black | 8,276 | 1.4% | +21.2% | |
| Total | 594,398 | 100% | +2.3% | |
| 1850 | White | 274,563 | 41.1% | +6.0% |
| Slave | 393,944 | 58.9% | +20.5% | |
| Total | 668,507 | 100% | +12.5% | |
| 1860 | White | 271,300 | 41.4% | +6.1% |
| Slave | 487,406 | 57.2% | +2.2% | |
| Free Black | 9,914 | 1.4% | +19.8% | |
| Other | 88 | 0.0% | – | |
| Total | 703,708 | 100% | +5.3% | |
| 1870 | White | 289,667 | 41.1% | -0.6% |
| Black | 465,814 | 58.9% | +3.3% | |
| Other | 125 | 0.0% | +42.1% | |
| Total | 705,606 | 100% | +0.3% | |
| 1880 | White | 391,105 | 39.3% | +35.0% |
| Black | 604,332 | 60.7% | +45.3% | |
| Other | 140 | 0.0% | +12.0% | |
| Total | 995,577 | 100% | +41.1% | |
| 1890 | White | 462,008 | 40.1% | +18.1% |
| Black | 728,934 | 59.9% | +14.0% | |
| Other | 207 | 0.0% | +47.9% | |
| Total | 1,151,149 | 100% | +15.6% | |
| 1900 | White | 547,807 | 41.6% | +20.7% |
| Black | 789,321 | 58.4% | +13.6% | |
| Other | 188 | 0.0% | -9.2% | |
| Total | 1,340,316 | 100% | +16.4% | |
| 1910 | White | 679,161 | 44.9% | +21.8% |
| Black | 833,843 | 55.1% | +6.6% | |
| Other | 396 | 0.0% | +110.6% | |
| Total | 1,515,400 | 100% | +13.1% | |
| 1920 | White | 878,538 | 51.4% | +20.5% |
| Black | 864,719 | 48.6% | +3.7% | |
| Other | 467 | 0.0% | +17.9% | |
| Total | 1,683,724 | 100% | +11.1% | |
| 1930 | White | 994,049 | 54.3% | +15.3% |
| Black | 693,681 | 45.6% | -8.2% | |
| Other | 1,035 | 0.1% | +121.6% | |
| Total | 1,738,765 | 100% | +3.3% | |
| 1940 | White | 1,084,308 | 57.1% | +14.9% |
| Black | 714,164 | 42.9% | +2.6% | |
| Other | 1,332 | 0.1% | +28.7% | |
| Total | 1,899,804 | 100% | +9.3% | |
| 1950 | White | 1,293,405 | 61.1% | +19.3% |
| Black | 722,077 | 38.8% | +1.0% | |
| Other | 1,545 | 0.1% | +16.0% | |
| Total | 2,117,027 | 100% | +11.4% | |
| 1960 | White | 1,551,022 | 65.1% | +19.9% |
| Black | 829,291 | 34.8% | +0.9% | |
| Other | 2,281 | 0.1% | +47.6% | |
| Total | 2,382,594 | 100% | +12.5% | |
| 1970 | White | 1,794,430 | 69.3% | +15.7% |
| Black | 789,041 | 30.4% | -4.9% | |
| Other | 7,045 | 0.3% | +208.9% | |
| Total | 2,590,516 | 100% | +8.7% | |
| 1980 | White | 2,147,224 | 68.8% | +19.7% |
| Black | 948,623 | 30.4% | +20.2% | |
| Other | 25,973 | 0.8% | +268.7% | |
| Total | 3,121,820 | 100% | +20.5% | |
| 1990 | White | 2,406,974 | 69.0% | +12.1% |
| Black | 1,039,884 | 29.8% | +9.6% | |
| Other | 39,845 | 1.2% | +53.4% | |
| Total | 3,486,703 | 100% | +11.7% | |
| 2000 | White | 2,695,560 | 67.2% | +12.0% |
| Black | 1,185,216 | 29.5% | +14.0% | |
| Other | 131,236 | 3.3% | +229.4% | |
| Total | 4,012,012 | 100% | +15.1% | |
| 2010 | White | 3,062,000 | 66.2% | +13.6% |
| Black | 1,290,684 | 27.9% | +8.9% | |
| Other | 274,680 | 5.9% | +109.3% | |
| Total | 4,625,364 | 100% | +15.3% |
Historical demographics
Beginning in 1790, the United States Census Bureau collected the population statistics of South Carolina. The years listed prior to that are estimates and exclude the Native American population. From 1790 until 1860, the designated demographic classifications were white, black slave and free black. Following the Civil War, the racial groupings were white, black and other. The following is a list of census data for the state of South Carolina:
| Census Year |
Demographic | Population | % of Pop. | % Growth |
|---|---|---|---|---|
| 1670 | White | 140 | 90.3% | – |
| Slave | 15 | 9.7% | – | |
| Total | 155 | 100% | - | |
| 1680 | White | 1,000 | 83.3% | +614.3% |
| Slave | 200 | 16.7% | +1233.3% | |
| Total | 1,200 | 100% | +674.2% | |
| 1700 | White | 3,100 | 56.4% | +210.0% |
| Slave | 2,400 | 43.6% | +1100.0% | |
| Total | 5,500 | 100% | +358.3% | |
| 1708 | White | 4,080 | 42.6% | +31.6% |
| Black Slaves | 4,100 | 42.8% | – | |
| Indian Slaves | 1,400 | 14.6% | – | |
| Total | 9,580 | 100% | +74.2% | |
| 1720 | White | 6,500 | 35.1% | +59.3% |
| Slave | 12,000 | 64.9% | +118.2% | |
| Total | 18,500 | 100% | +93.1% | |
| 1730 | White | 10,000 | 33.3% | +53.9% |
| Slave | 20,000 | 66.7% | +66.7% | |
| Total | 30,000 | 100% | +62.2% | |
| 1740 | White | 20,000 | 33.3% | +100.0% |
| Slave | 40,000 | 66.7% | +100.0% | |
| Total | 60,000 | 100% | +100.0% | |
| 1750 | White | 21,667 | 33.3% | +8.3% |
| Slave | 43,333 | 66.7% | +8.3% | |
| Total | 65,000 | 100% | +8.3% | |
| 1760 | White | 32,000 | 38.1% | +47.7% |
| Slave | 52,000 | 61.9% | +20.0% | |
| Total | 84,000 | 100% | +29.2% | |
| 1770 | White | 50,000 | 38.5% | +56.3% |
| Slave | 80,000 | 61.5% | +53.9% | |
| Total | 130,000 | 100% | +54.7% | |
| 1780 | White | 83,000 | 46.1% | +66.0% |
| Slave | 97,000 | 53.9% | +21.3% | |
| Total | 180,000 | 100% | +38.5% | |
| 1790 | White | 140,178 | 56.3% | +68.9% |
| Slave | 107,094 | 43.0% | +10.4% | |
| Free Black | 1,801 | 0.7% | – | |
| Total | 249,073 | 100% | +38.4% | |
| 1800 | White | 196,255 | 56.8% | +40.0% |
| Slave | 146,151 | 42.3% | +36.5% | |
| Free Black | 3,185 | 0.9% | +76.9% | |
| Total | 345,591 | 100% | +38.8% | |
| 1810 | White | 214,196 | 51.6% | +9.1% |
| Slave | 196,365 | 47.3% | +34.4% | |
| Free Black | 4,554 | 1.1% | +42.9% | |
| Total | 415,115 | 100% | +20.1% | |
| 1820 | White | 237,440 | 47.2% | +10.9% |
| Slave | 258,475 | 51.4% | +31.6% | |
| Free Black | 6,826 | 1.4% | +49.9% | |
| Total | 502,741 | 100% | +21.1% | |
| 1830 | White | 257,863 | 44.4% | +8.6% |
| Slave | 323,322 | 55.6% | +25.1% | |
| Total | 581,185 | 100% | +15.6% | |
| 1840 | White | 259,084 | 43.6% | +0.5% |
| Slave | 327,038 | 55.0% | +1.2% | |
| Free Black | 8,276 | 1.4% | +21.2% | |
| Total | 594,398 | 100% | +2.3% | |
| 1850 | White | 274,563 | 41.1% | +6.0% |
| Slave | 393,944 | 58.9% | +20.5% | |
| Total | 668,507 | 100% | +12.5% | |
| 1860 | White | 271,300 | 41.4% | +6.1% |
| Slave | 487,406 | 57.2% | +2.2% | |
| Free Black | 9,914 | 1.4% | +19.8% | |
| Other | 88 | 0.0% | – | |
| Total | 703,708 | 100% | +5.3% | |
| 1870 | White | 289,667 | 41.1% | -0.6% |
| Black | 465,814 | 58.9% | +3.3% | |
| Other | 125 | 0.0% | +42.1% | |
| Total | 705,606 | 100% | +0.3% | |
| 1880 | White | 391,105 | 39.3% | +35.0% |
| Black | 604,332 | 60.7% | +45.3% | |
| Other | 140 | 0.0% | +12.0% | |
| Total | 995,577 | 100% | +41.1% | |
| 1890 | White | 462,008 | 40.1% | +18.1% |
| Black | 728,934 | 59.9% | +14.0% | |
| Other | 207 | 0.0% | +47.9% | |
| Total | 1,151,149 | 100% | +15.6% | |
| 1900 | White | 547,807 | 41.6% | +20.7% |
| Black | 789,321 | 58.4% | +13.6% | |
| Other | 188 | 0.0% | -9.2% | |
| Total | 1,340,316 | 100% | +16.4% | |
| 1910 | White | 679,161 | 44.9% | +21.8% |
| Black | 833,843 | 55.1% | +6.6% | |
| Other | 396 | 0.0% | +110.6% | |
| Total | 1,515,400 | 100% | +13.1% | |
| 1920 | White | 878,538 | 51.4% | +20.5% |
| Black | 864,719 | 48.6% | +3.7% | |
| Other | 467 | 0.0% | +17.9% | |
| Total | 1,683,724 | 100% | +11.1% | |
| 1930 | White | 994,049 | 54.3% | +15.3% |
| Black | 693,681 | 45.6% | -8.2% | |
| Other | 1,035 | 0.1% | +121.6% | |
| Total | 1,738,765 | 100% | +3.3% | |
| 1940 | White | 1,084,308 | 57.1% | +14.9% |
| Black | 714,164 | 42.9% | +2.6% | |
| Other | 1,332 | 0.1% | +28.7% | |
| Total | 1,899,804 | 100% | +9.3% | |
| 1950 | White | 1,293,405 | 61.1% | +19.3% |
| Black | 722,077 | 38.8% | +1.0% | |
| Other | 1,545 | 0.1% | +16.0% | |
| Total | 2,117,027 | 100% | +11.4% | |
| 1960 | White | 1,551,022 | 65.1% | +19.9% |
| Black | 829,291 | 34.8% | +0.9% | |
| Other | 2,281 | 0.1% | +47.6% | |
| Total | 2,382,594 | 100% | +12.5% | |
| 1970 | White | 1,794,430 | 69.3% | +15.7% |
| Black | 789,041 | 30.4% | -4.9% | |
| Other | 7,045 | 0.3% | +208.9% | |
| Total | 2,590,516 | 100% | +8.7% | |
| 1980 | White | 2,147,224 | 68.8% | +19.7% |
| Black | 948,623 | 30.4% | +20.2% | |
| Other | 25,973 | 0.8% | +268.7% | |
| Total | 3,121,820 | 100% | +20.5% | |
| 1990 | White | 2,406,974 | 69.0% | +12.1% |
| Black | 1,039,884 | 29.8% | +9.6% | |
| Other | 39,845 | 1.2% | +53.4% | |
| Total | 3,486,703 | 100% | +11.7% | |
| 2000 | White | 2,695,560 | 67.2% | +12.0% |
| Black | 1,185,216 | 29.5% | +14.0% | |
| Other | 131,236 | 3.3% | +229.4% | |
| Total | 4,012,012 | 100% | +15.1% | |
| 2010 | White | 3,062,000 | 66.2% | +13.6% |
| Black | 1,290,684 | 27.9% | +8.9% | |
| Other | 274,680 | 5.9% | +109.3% | |
| Total | 4,625,364 | 100% | +15.3% |
Images for kids
-
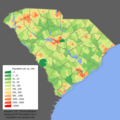
South Carolina Population Density in 2010.
-
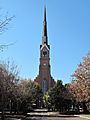
St. Matthew's German Evangelical Lutheran Church in Charleston is the tallest house of worship in the state. Its spire rises 255 feet.
-
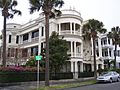
Charleston – Atlantic Street at E. Battery Street
-
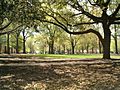
Columbia – USC Horseshoe – listed on National Register of Historic Places
-

Columbia – Skyline from Arsenal Hill
-
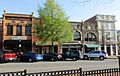
Spartanburg – Historical buildings on West Main
-

Greenville – Skyline by night
-
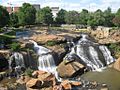
Greenville – Falls in Downtown area.
-

Hilton Head Island – Harbour Town
-
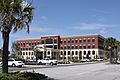
North Charleston – City Hall

.jpg)


