Quick facts for kids {{{Name}}}
[[{{{Type}}} constituency]] |
[[Image:{{{Map1}}}Constituency.svg|120px|]]
[[Image:England{{{Map2}}}.svg|120px|]] |
| {{{Name}}} shown within [[{{{Entity}}}]], and {{{Entity}}} shown within England |
| Created: |
{{{Year}}} |
| MP: |
{{{MP}}} |
| Party: |
{{{Party}}} |
| Type: |
House of Commons |
| County: |
[[{{{County}}}]] |
| EP constituency: |
[[{{{EP}}} (European Parliament constituency)|{{{EP}}}]] |
Greenwich was a constituency in south-east London, which returned at first two, then (from 1885) one member (MP) to the House of Commons of the UK Parliament. It existed from 1832 to 1997. Elections used the first past the post system; when this elects more than one member, it is sometimes called plurality-at-large voting.
History
From 1832 until 1885 it was a two-member constituency. Under the Redistribution of Seats Act 1885 associated with the Reform Act 1884, its area was reduced overall (although it gained Kidbrooke) and it was reduced to one seat. For the 1997 general election, it was merged with part of the former Woolwich constituency to form the Greenwich and Woolwich seat.
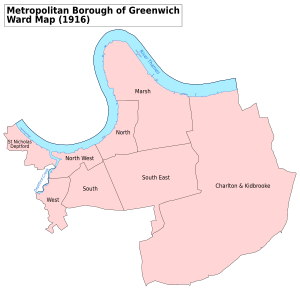
wards of Greenwich Metropolitan Borough in 1916
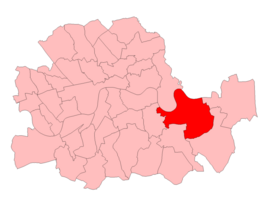
The seat and others in the County of London 1950–74
Its history is dominated by the area's strong maritime tradition. Its most prominent claim to fame was as the seat of William Ewart Gladstone between 1868 and 1880, and it also achieved prominence in the 1987 Greenwich by-election, when the SDP won a surprise victory.
Boundaries
1832–1885: the parishes of Greenwich; St Nicholas and St Paul Deptford; and the most populous parts of Charlton and Woolwich. detailed as: "From the Point at which the Royal Arsenal Canal at Woolwich joins the Thames, along the said Canal to the southern extremity thereof; thence in a straight Line to the south-western corner of the Ordnance Storekeeper's House; thence in a straight Line, in the Direction of a Stile in the footpath from Woolwich to Plumstead Common, over Sand Hill, to the Boundary of the Parish of Woolwich; thence, southward, along the boundary of the parish of Woolwich to the point at which the same meets the Boundary of the parish of Charlton; thence westward along the Boundary of the parish of Charlton to the point at which the same turns southward near the Dovor Road; thence along the Dovor Road to the nearest point of the boundary of the parish of Greenwich; thence Westward, along the boundary of the parish of Greenwich to the point at which the same turns abruptly to the south, close by the Dovor Road, thence in a straight line, in a westerly direction, to the nearest point of the boundary of the parish of Greenwich, thence westward along the boundary of the parish of Greenwich to the point at which the same meets the boundary of the parish of Saint Paul Deptford; thence southward along the boundary of the parish of Saint Paul Deptford to the point at which the same meets the Thames; thence along the Thames to the point first described." The boundaries were thus in the schedules of the Parliamentary Boundaries Act 1832.
1885–1918: The parishes of Greenwich, St Nicholas Deptford, Charlton, and Kidbrooke.
1918–1974: The Metropolitan Borough of Greenwich.
1974–1983: The London Borough of Greenwich wards of Blackheath, Charlton, Eastcombe, Hornfair, Kidbrooke, Marsh, Park, Trafalgar, Vanbrugh, and West.
1983–1997: The London Borough of Greenwich wards of Blackheath, Charlton, Ferrier, Hornfair, Kidbrooke, Rectory Field, St Alfege, Trafalgar, Vanbrugh, and West.
Between 1983 and 1997, the constituency formed the western part of the Royal Borough of Greenwich.
Members of Parliament
MPs 1832–1885
MPs since 1885
Election results
Elections in the 1830s
| 1832 general election: Greenwich |
| Party |
Candidate |
Votes |
% |
±% |
|
Whig |
James Whitley Deans Dundas |
1,633 |
39.6 |
|
|
Radical |
Edward George Barnard |
1,442 |
35.0 |
|
|
Whig |
John Angerstein |
1,033 |
25.1 |
|
|
Radical |
Frederick George Hammond |
15 |
0.4 |
|
| Turnout |
2,391 |
88.1 |
|
| Registered electors |
2,714 |
|
|
| Majority |
191 |
4.6 |
|
|
Whig win (new seat) |
| Majority |
409 |
9.9 |
|
| style="background-color: Template:Radicals (UK)/meta/color" | |
[[Radicals (UK)|Template:Radicals (UK)/meta/shortname]] win (new seat) |
| 1835 general election: Greenwich |
| Party |
Candidate |
Votes |
% |
±% |
|
Whig |
John Angerstein |
1,826 |
45.8 |
−18.8 |
|
Radical |
Edward George Barnard |
1,102 |
27.6 |
−7.8 |
|
Conservative |
Matthias Wolverley Attwood |
1,063 |
26.6 |
New |
| Turnout |
2,210 |
87.8 |
−0.3 |
| Registered electors |
2,516 |
|
|
| Majority |
724 |
18.2 |
+13.6 |
|
Whig hold |
Swing |
−7.5 |
|
| Majority |
39 |
1.0 |
−8.9 |
| style="background-color: Template:Radicals (UK)/meta/color" | |
[[Radicals (UK)|Template:Radicals (UK)/meta/shortname]] hold |
Swing |
+7.5 |
|
| 1837 general election: Greenwich |
| Party |
Candidate |
Votes |
% |
±% |
|
Conservative |
Matthias Wolverley Attwood |
1,368 |
36.8 |
+10.2 |
|
Radical |
Edward George Barnard |
1,194 |
32.1 |
+4.5 |
|
Radical |
Charles Napier |
1,158 |
31.1 |
N/A |
| Turnout |
2,434 |
78.3 |
−9.5 |
| Registered electors |
3,107 |
|
|
| Majority |
174 |
4.7 |
N/A |
|
Conservative gain from Whig |
Swing |
+2.9 |
|
| Majority |
36 |
1.0 |
±0.0 |
| style="background-color: Template:Radicals (UK)/meta/color" | |
[[Radicals (UK)|Template:Radicals (UK)/meta/shortname]] hold |
Swing |
−2.9 |
|
Elections in the 1840s
| 1841 general election: Greenwich |
| Party |
Candidate |
Votes |
% |
±% |
|
Whig |
James Whitley Deans Dundas |
1,747 |
37.9 |
New |
|
Radical |
Edward George Barnard |
1,592 |
34.5 |
+2.4 |
|
Conservative |
George Cockburn |
1,274 |
27.6 |
−9.2 |
| Turnout |
2,848 |
74.7 |
−3.6 |
| Registered electors |
3,811 |
|
|
| Majority |
155 |
3.4 |
N/A |
|
Whig gain from Conservative |
Swing |
N/A |
|
| Majority |
318 |
6.9 |
+5.9 |
| style="background-color: Template:Radicals (UK)/meta/color" | |
[[Radicals (UK)|Template:Radicals (UK)/meta/shortname]] hold |
Swing |
+3.5 |
|
Dundas was appointed a Lord Commissioner of the Admiralty, requiring a by-election.
| By-election, 13 July 1846: Greenwich |
| Party |
Candidate |
Votes |
% |
±% |
|
Whig |
James Whitley Deans Dundas |
Unopposed |
|
Whig hold |
| 1847 general election: Greenwich |
| Party |
Candidate |
Votes |
% |
±% |
|
Whig |
James Whitley Deans Dundas |
2,409 |
46.7 |
+8.8 |
|
Radical |
Edward George Barnard |
1,511 |
29.3 |
−5.2 |
|
Radical |
David Salomons |
1,236 |
24.0 |
N/A |
| Turnout |
2,578 (est) |
49.7 (est) |
−25.0 |
| Registered electors |
5,187 |
|
|
| Majority |
1,173 |
22.7 |
+19.3 |
|
Whig hold |
Swing |
+7.0 |
|
| style="background-color: Template:Radicals (UK)/meta/color" | |
[[Radicals (UK)|Template:Radicals (UK)/meta/shortname]] hold |
Swing |
−7.0 |
|
Elections in the 1850s
Barnard's death caused a by-election.
| By-election, 28 June 1851: Greenwich |
| Party |
Candidate |
Votes |
% |
±% |
|
Radical |
David Salomons |
2,165 |
62.9 |
+38.9 |
|
Radical |
David Williams Wire |
1,278 |
37.1 |
N/A |
| Majority |
887 |
25.8 |
N/A |
| Turnout |
3,443 |
57.2 |
+7.5 |
| Registered electors |
6,022 |
|
|
| style="background-color: Template:Radicals (UK)/meta/color" | |
[[Radicals (UK)|Template:Radicals (UK)/meta/shortname]] hold |
Swing |
N/A |
|
Dundas resigned after being appointed Commander of the Mediterranean Fleet, causing a by-election.
| By-election, 11 February 1852: Greenwich |
| Party |
Candidate |
Votes |
% |
±% |
|
Whig |
Houston Stewart |
2,956 |
70.9 |
+24.2 |
|
Radical |
Montague Chambers |
1,211 |
29.1 |
−24.2 |
| Majority |
1,745 |
41.8 |
+19.1 |
| Turnout |
4,167 |
66.1 |
+16.4 |
| Registered electors |
6,308 |
|
|
|
Whig hold |
Swing |
+24.2 |
|
| 1852 general election: Greenwich |
| Party |
Candidate |
Votes |
% |
±% |
|
Conservative |
Peter Rolt |
2,415 |
30.6 |
New |
|
Radical |
Montague Chambers |
2,360 |
29.9 |
+0.6 |
|
Whig |
Houston Stewart |
2,026 |
25.6 |
−41.1 |
|
Radical |
David Salomons |
1,102 |
13.9 |
−10.1 |
| Turnout |
5,159 (est) |
81.8 (est) |
+32.1 |
| Registered electors |
6,308 |
|
|
| Majority |
55 |
0.7 |
N/A |
|
Conservative gain from Whig |
Swing |
N/A |
|
| Majority |
334 |
4.3 |
N/A |
| style="background-color: Template:Radicals (UK)/meta/color" | |
[[Radicals (UK)|Template:Radicals (UK)/meta/shortname]] hold |
Swing |
+10.6 |
|
Rolt resigned, causing a by-election.
| By-election, 9 February 1857: Greenwich |
| Party |
Candidate |
Votes |
% |
±% |
|
Whig |
William Codrington |
2,975 |
65.8 |
+30.2 |
|
Radical |
Arthur B. Sleigh |
1,543 |
34.2 |
−9.6 |
| Majority |
1,432 |
31.6 |
N/A |
| Turnout |
4,518 |
57.3 |
−24.5 |
| Registered electors |
7,888 |
|
|
|
Whig gain from Conservative |
Swing |
+19.9 |
|
| 1857 general election: Greenwich |
| Party |
Candidate |
Votes |
% |
±% |
|
Whig |
William Codrington |
2,985 |
38.1 |
+12.5 |
|
Radical |
John Townsend |
2,784 |
35.5 |
+21.6 |
|
Radical |
Montague Chambers |
2,065 |
26.4 |
−3.5 |
| Majority |
719 |
9.1 |
N/A |
| Turnout |
3,917 (est) |
49.7 (est) |
−32.1 |
| Registered electors |
7,888 |
|
|
|
Whig gain from Conservative |
Swing |
+1.8 |
|
| style="background-color: Template:Radicals (UK)/meta/color" | |
[[Radicals (UK)|Template:Radicals (UK)/meta/shortname]] hold |
Swing |
+4.6 |
|
Townsend resigned after becoming a bankrupt, also leading to his suspension from the House of Commons.
| By-election, 16 February 1859: Greenwich |
| Party |
Candidate |
Votes |
% |
±% |
|
Radical |
David Salomons |
3,444 |
57.7 |
−4.2 |
|
Whig |
William Angerstein |
2,523 |
42.3 |
+4.2 |
| Majority |
921 |
15.4 |
N/A |
| Turnout |
5,967 |
75.1 |
+25.4 |
| Registered electors |
7,942 |
|
|
| style="background-color: Template:Radicals (UK)/meta/color" | |
[[Radicals (UK)|Template:Radicals (UK)/meta/shortname]] hold |
Swing |
−4.2 |
|
Elections in the 1860s
Gladstone's appointment as Prime Minister and First Lord of the Treasury caused a by-election.
Elections in the 1870s
Salomons' death caused a by-election.
| By-election, 4 Aug 1873: Greenwich |
| Party |
Candidate |
Votes |
% |
±% |
|
Conservative |
Thomas Boord |
4,525 |
54.2 |
+13.3 |
|
Radical Liberal |
Baxter Langley |
2,379 |
28.5 |
New |
|
Liberal |
William Angerstein |
1,064 |
12.7 |
−46.3 |
|
Radical Liberal |
John Bennett |
324 |
3.9 |
New |
|
Liberal-Conservative |
Robert Coningsby |
27 |
0.3 |
New |
|
Ind. Conservative |
Henry Pook |
27 |
0.3 |
New |
| Majority |
2,146 |
25.7 |
N/A |
| Turnout |
8,346 |
52.2 |
−18.8 |
| Registered electors |
15,990 |
|
|
|
Conservative gain from Liberal |
Swing |
+29.8 |
|
Elections in the 1880s
Elections in the 1890s
Elections in the 1900s
- Cecil was a free-trader and Benn was a supporter of tariff reform
Elections in the 1910s
Elections in the 1920s
| General election 1922: Greenwich |
| Party |
Candidate |
Votes |
% |
±% |
|
Unionist |
George Hume |
16,934 |
60.9 |
−8.4 |
|
Labour |
Edward Timothy Palmer |
10,860 |
39.1 |
+8.4 |
| Majority |
6,074 |
21.8 |
−16.8 |
| Turnout |
27,794 |
60.4 |
+12.3 |
| Registered electors |
46,005 |
|
|
|
Unionist hold |
Swing |
−8.4 |
|
| General election 1923: Greenwich |
| Party |
Candidate |
Votes |
% |
±% |
|
Labour |
Edward Timothy Palmer |
12,314 |
42.7 |
+3.6 |
|
Unionist |
George Hume |
10,746 |
37.2 |
−23.7 |
|
Liberal |
Charles Garfield Lott Du Cann |
5,806 |
20.1 |
new |
| Majority |
1,568 |
5.5 |
n/a |
| Turnout |
28,866 |
61.8 |
+1.4 |
| Registered electors |
46,741 |
|
|
|
Labour gain from Unionist |
Swing |
+13.7 |
|
| General election 30 May 1929: Greenwich |
| Party |
Candidate |
Votes |
% |
±% |
|
Labour |
Edward Timothy Palmer |
20,328 |
46.3 |
−2.2 |
|
Unionist |
George Hume |
16,710 |
38.1 |
−13.4 |
|
Liberal |
William Primrose Campbell |
6,870 |
15.6 |
new |
| Majority |
3,618 |
8.2 |
n/a |
| Turnout |
43,908 |
70.4 |
−4.8 |
| Registered electors |
62,342 |
|
|
|
Labour gain from Unionist |
Swing |
+5.6 |
|
Elections in the 1930s
| General election 1931: Greenwich |
| Party |
Candidate |
Votes |
% |
±% |
|
Conservative |
George Hume |
29,278 |
65.0 |
+26.9 |
|
Labour |
Edward Timothy Palmer |
13,722 |
30.5 |
-15.8 |
|
Communist |
Kath Duncan |
2,024 |
4.5 |
New |
| Majority |
15,556 |
34.6 |
N/A |
| Turnout |
45,024 |
71.0 |
+0.6 |
| Registered electors |
63,385 |
|
|
|
Conservative gain from Labour |
Swing |
+21.35 |
|
| General election 1935: Greenwich |
| Party |
Candidate |
Votes |
% |
±% |
|
Conservative |
George Hume |
22,526 |
52.43 |
-12.60 |
|
Labour |
Joseph Reeves |
20,436 |
47.57 |
+17.09 |
| Majority |
2,090 |
4.86 |
-29.7 |
| Turnout |
49,213 |
67.79 |
-3.24 |
| Registered electors |
72,599 |
|
|
|
Conservative hold |
Swing |
-14.85 |
|
Elections in the 1940s
Elections in the 1950s
| General election 1951: Greenwich |
| Party |
Candidate |
Votes |
% |
±% |
|
Labour |
Joseph Reeves |
30,326 |
60.38 |
+2.53 |
|
Conservative |
William H Bishop |
19,898 |
39.62 |
+3.67 |
| Majority |
10,428 |
20.76 |
-1.14 |
| Turnout |
50,224 |
80.95 |
-2.03 |
| Registered electors |
62,042 |
|
|
|
Labour hold |
Swing |
-0.57 |
|
| General election 1955: Greenwich |
| Party |
Candidate |
Votes |
% |
±% |
|
Labour |
Joseph Reeves |
26,423 |
58.84 |
-1.54 |
|
Conservative |
William F Rhodes |
18,484 |
41.16 |
+1.54 |
| Majority |
7,939 |
17.68 |
-3.08 |
| Turnout |
44,907 |
73.24 |
-7.71 |
| Registered electors |
61,314 |
|
|
|
Labour hold |
Swing |
-1.54 |
|
Elections in the 1960s
Elections in the 1970s
| 1971 Greenwich by-election |
| Party |
Candidate |
Votes |
% |
±% |
|
Labour |
Guy Barnett |
14,671 |
66.73 |
+10.98 |
|
Conservative |
J Stuart Thom |
6,150 |
27.97 |
-7.39 |
|
Fellowship |
Ronald Stephen Mallone |
792 |
3.60 |
New |
|
Ind. Conservative |
Reginald Simmerson |
285 |
1.30 |
New |
|
Independent |
David Davies |
89 |
0.40 |
New |
| Majority |
8,521 |
38.76 |
+18.37 |
| Turnout |
21,987 |
|
|
|
Labour hold |
Swing |
|
|
| General election 1979: Greenwich |
| Party |
Candidate |
Votes |
% |
±% |
|
Labour |
Guy Barnett |
18,975 |
52.1 |
-3.4 |
|
Conservative |
Narindar Singh Saroop |
12,133 |
33.3 |
+6.5 |
|
Liberal |
Graham Howard Knight |
3,870 |
10.6 |
-6.3 |
|
National Front |
Helena Mary Steven |
951 |
2.6 |
New |
|
Fellowship |
Ronald Stephen Mallone |
460 |
1.3 |
New |
| Majority |
6,842 |
18.8 |
-9.9 |
| Turnout |
36,389 |
70.6 |
+5.3 |
|
Labour hold |
Swing |
-5.0 |
|
Elections in the 1980s
| General election 1983: Greenwich |
| Party |
Candidate |
Votes |
% |
±% |
|
Labour |
Guy Barnett |
13,361 |
38.2 |
−13.9 |
|
Conservative |
Arthur Rolfe |
12,150 |
34.8 |
+1.5 |
|
SDP |
T. Ford |
8,783 |
25.1 |
New |
|
BNP |
Ian Dell |
259 |
0.7 |
New |
|
Fellowship |
Ronald Mallone |
242 |
0.7 |
−0.6 |
|
Communist |
F. Hook |
149 |
0.4 |
New |
| Majority |
1,211 |
3.4 |
−15.4 |
| Turnout |
35,194 |
67.7 |
−2.9 |
|
Labour hold |
Swing |
|
|
| By-election 1987: Greenwich |
| Party |
Candidate |
Votes |
% |
±% |
|
SDP |
Rosie Barnes |
18,287 |
53.0 |
+27.9 |
|
Labour |
Deirdre Wood |
11,676 |
33.8 |
−4.4 |
|
Conservative |
John Antcliffe |
3,852 |
11.2 |
−23.6 |
|
Green (UK) |
Graham Bell |
264 |
0.8 |
New |
|
Rainbow Dream Ticket |
Malcolm Hardee |
124 |
0.3 |
New |
|
BNP |
Ian Dell |
116 |
0.3 |
−0.4 |
|
National Front |
Joe Pearce |
103 |
0.3 |
New |
|
Revolutionary Communist |
Kate Marshall |
91 |
0.3 |
New |
| Majority |
6,611 |
19.2 |
+15.7 |
| Turnout |
34,513 |
68.2 |
-4.5 |
|
SDP gain from Labour |
Swing |
+16.2 |
|
| General election 1987: Greenwich |
| Party |
Candidate |
Votes |
% |
±% |
|
SDP |
Rosie Barnes |
15,149 |
40.6 |
+15.5 |
|
Labour |
Deirdre Wood |
13,008 |
34.9 |
−3.3 |
|
Conservative |
John Antcliffe |
8,695 |
23.3 |
−11.5 |
|
Green (UK) |
Jacqueline Thomas |
346 |
0.9 |
New |
|
Fellowship |
Ronald Mallone |
59 |
0.2 |
−0.5 |
|
Communist |
Patricia Clinton |
58 |
0.2 |
−0.2 |
| Majority |
2,141 |
5.7 |
+2.3 |
| Turnout |
37,315 |
73.4 |
+5.7 |
|
SDP gain from Labour |
Swing |
+9.4 |
|
- swings relative to 1983 election, not 1987 by-election
Elections in the 1990s
| General election 1992: Greenwich |
| Party |
Candidate |
Votes |
% |
±% |
|
Labour |
Nick Raynsford |
14,630 |
41.0 |
+6.1 |
|
Independent Social Democrat |
Rosie Barnes |
13,273 |
37.2 |
-3.4 |
|
Conservative |
Alison McNair |
6,960 |
19.5 |
−3.8 |
|
Green |
Robert H.J. McCracken |
483 |
1.4 |
+0.5 |
|
Fellowship |
Ronald Mallone |
147 |
0.4 |
+0.2 |
|
Independent |
Malcolm Hardee |
103 |
0.3 |
New |
|
Natural Law |
John D. Small |
70 |
0.2 |
New |
| Majority |
1,357 |
3.8 |
N/A |
| Turnout |
35,666 |
74.6 |
+1.2 |
|
Labour gain from SDP |
Swing |
+4.8 |
|
- The swing for Rosie Barnes is relative to her performance in the 1987 general election.


