
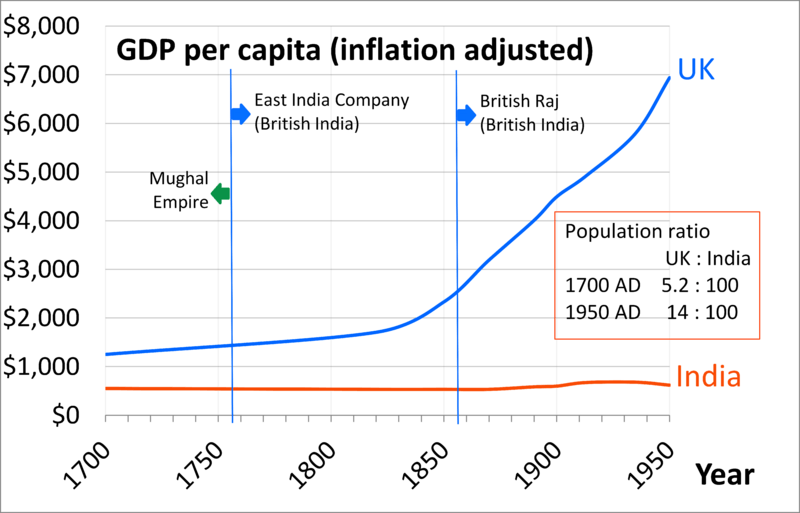
Image: 1700 AD through 1950 AD per capita GDP of United Kingdom and India during the Colonial Era

Description: This map shows the change in per capita GDP of United Kingdom and India from 1700 AD to 1950 AD. This period includes the 1757 to 1950 period, considered to be the British colonial era in India. All GDP numbers are inflation adjusted to 1990 International Geary-Khamis dollars. Data Source: Tables of Prof. Angus Maddison (2010). The per capita GDP over various years and population data can be downloaded in a spreadsheet from here. The per capita and population ratio data in this chart is also available in hardcopy version here: Maddison A (2007), Contours of the World Economy I-2030AD, Oxford University Press, ISBN 978-0199227204
Title: 1700 AD through 1950 AD per capita GDP of United Kingdom and India during the Colonial Era
Credit: Own work
Author: M Tracy Hunter
Usage Terms: Creative Commons Attribution-Share Alike 4.0
License: CC BY-SA 4.0
License Link: http://creativecommons.org/licenses/by-sa/4.0
Attribution Required?: Yes
Image usage
The following page links to this image:
