
Image: 1980- Cost of billion dollar hurricanes - US - variwide chart - NOAA data

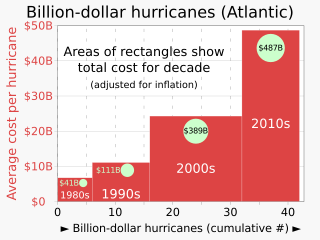
Description: Variwide (variable-width) bar chart showing number of U.S. hurricanes, cost per hurricane, and total cost per decade, organized by decade starting in 1980 Source of data for this graphic: Philbrick, Ian Pasad; Wu, Ashley, (2 December 2022). "Population Growth Is Making Hurricanes More Expensive". The New York Times. Newspaper states data source: NOAA.Archive thereof: https://web.archive.org/web/20221206130032/https://www.nytimes.com/2022/12/02/briefing/why-hurricanes-cost-more.htmlSuggested caption: The number of $1 billion Atlantic hurricanes almost doubled from the 1980s to the 2010s, and inflation-adjusted costs have increased more than elevenfold. The increases have been attributed to climate change and to greater numbers of people moving to coastal areas. This graphic was created manually in a text editor.
This SVG file contains embedded text that can be translated into your language, using any capable SVG editor, text editor or the SVG Translate tool. For more information see: About translating SVG files.
Author: RCraig09
Usage Terms: Creative Commons Attribution-Share Alike 3.0
License: CC-BY-SA-3.0
License Link: http://creativecommons.org/licenses/by-sa/3.0/
Attribution Required?: Yes
Image usage
The following page links to this image:
