
Image: 1994- Global average temperature during June-July-August

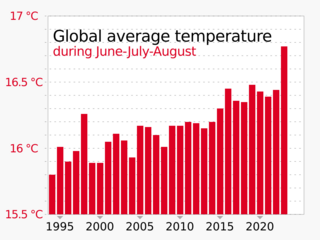
Description: Chart showing global average surface temperature during the months of June, July, August ("boreal summer") Uploader's note: Uploader envisions this chart as being specific to the time period ending in 2023, designed for use mainly in articles about 2023 in particular. Please don't update this chart with future years' data. Upload a separate file for your other purpose. Data source: August Climate Bulletins / Summer 2023: the hottest on record. Copernicus Programme (6 September 2023). Archived from the original on 8 September 2023. Technical note: most SVG code was automatically generated by the "Bar charts (column charts)" spreadsheet linked at User:RCraig09/Excel to XML for SVG. Minor additions and adjustments were made in a text editor. This SVG file contains embedded text that can be translated into your language, using any capable SVG editor, text editor or the SVG Translate tool. For more information see: About translating SVG files.
Title: 1994- Global average temperature during June-July-August
Credit: Own work
Author: RCraig09
Usage Terms: Creative Commons Attribution-Share Alike 4.0
License: CC BY-SA 4.0
License Link: https://creativecommons.org/licenses/by-sa/4.0
Attribution Required?: Yes
Image usage
The following page links to this image:
