
Image: 2012lemon and lime

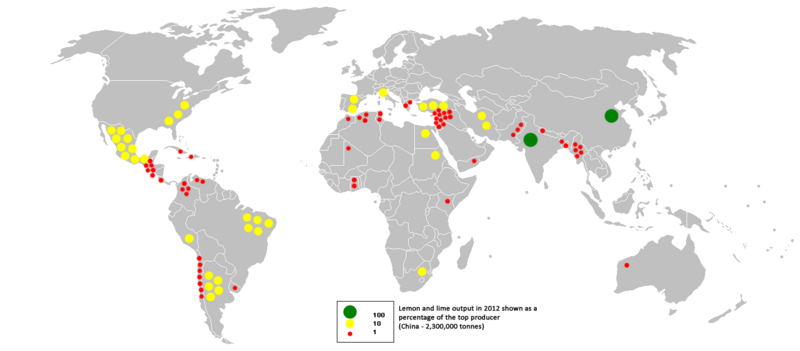
Description: This bubble map shows the global distribution of lemon and lime output in 2012 as a percentage of the top producer (China - 2,300,000 tonnes). This map is consistent with incomplete set of data too as long as the top producer is known. It resolves the accessibility issues faced by colour-coded maps that may not be properly rendered in old computer screens. Data was extracted on 17th March 2015 from http://faostat.fao.org/site/336/DesktopDefault.aspx?PageID=336 Based on Image:BlankMap-World.png (description from original file at English Wikipedia)
Title: 2012lemon and lime
Credit: Own work
Author: Swidran
Usage Terms: Creative Commons Attribution-Share Alike 4.0
License: CC BY-SA 4.0
License Link: http://creativecommons.org/licenses/by-sa/4.0
Attribution Required?: Yes
Image usage
The following page links to this image:
