
Image: 20190705 Warming stripes - Berkeley Earth (world) - avg above- and below-ice readings
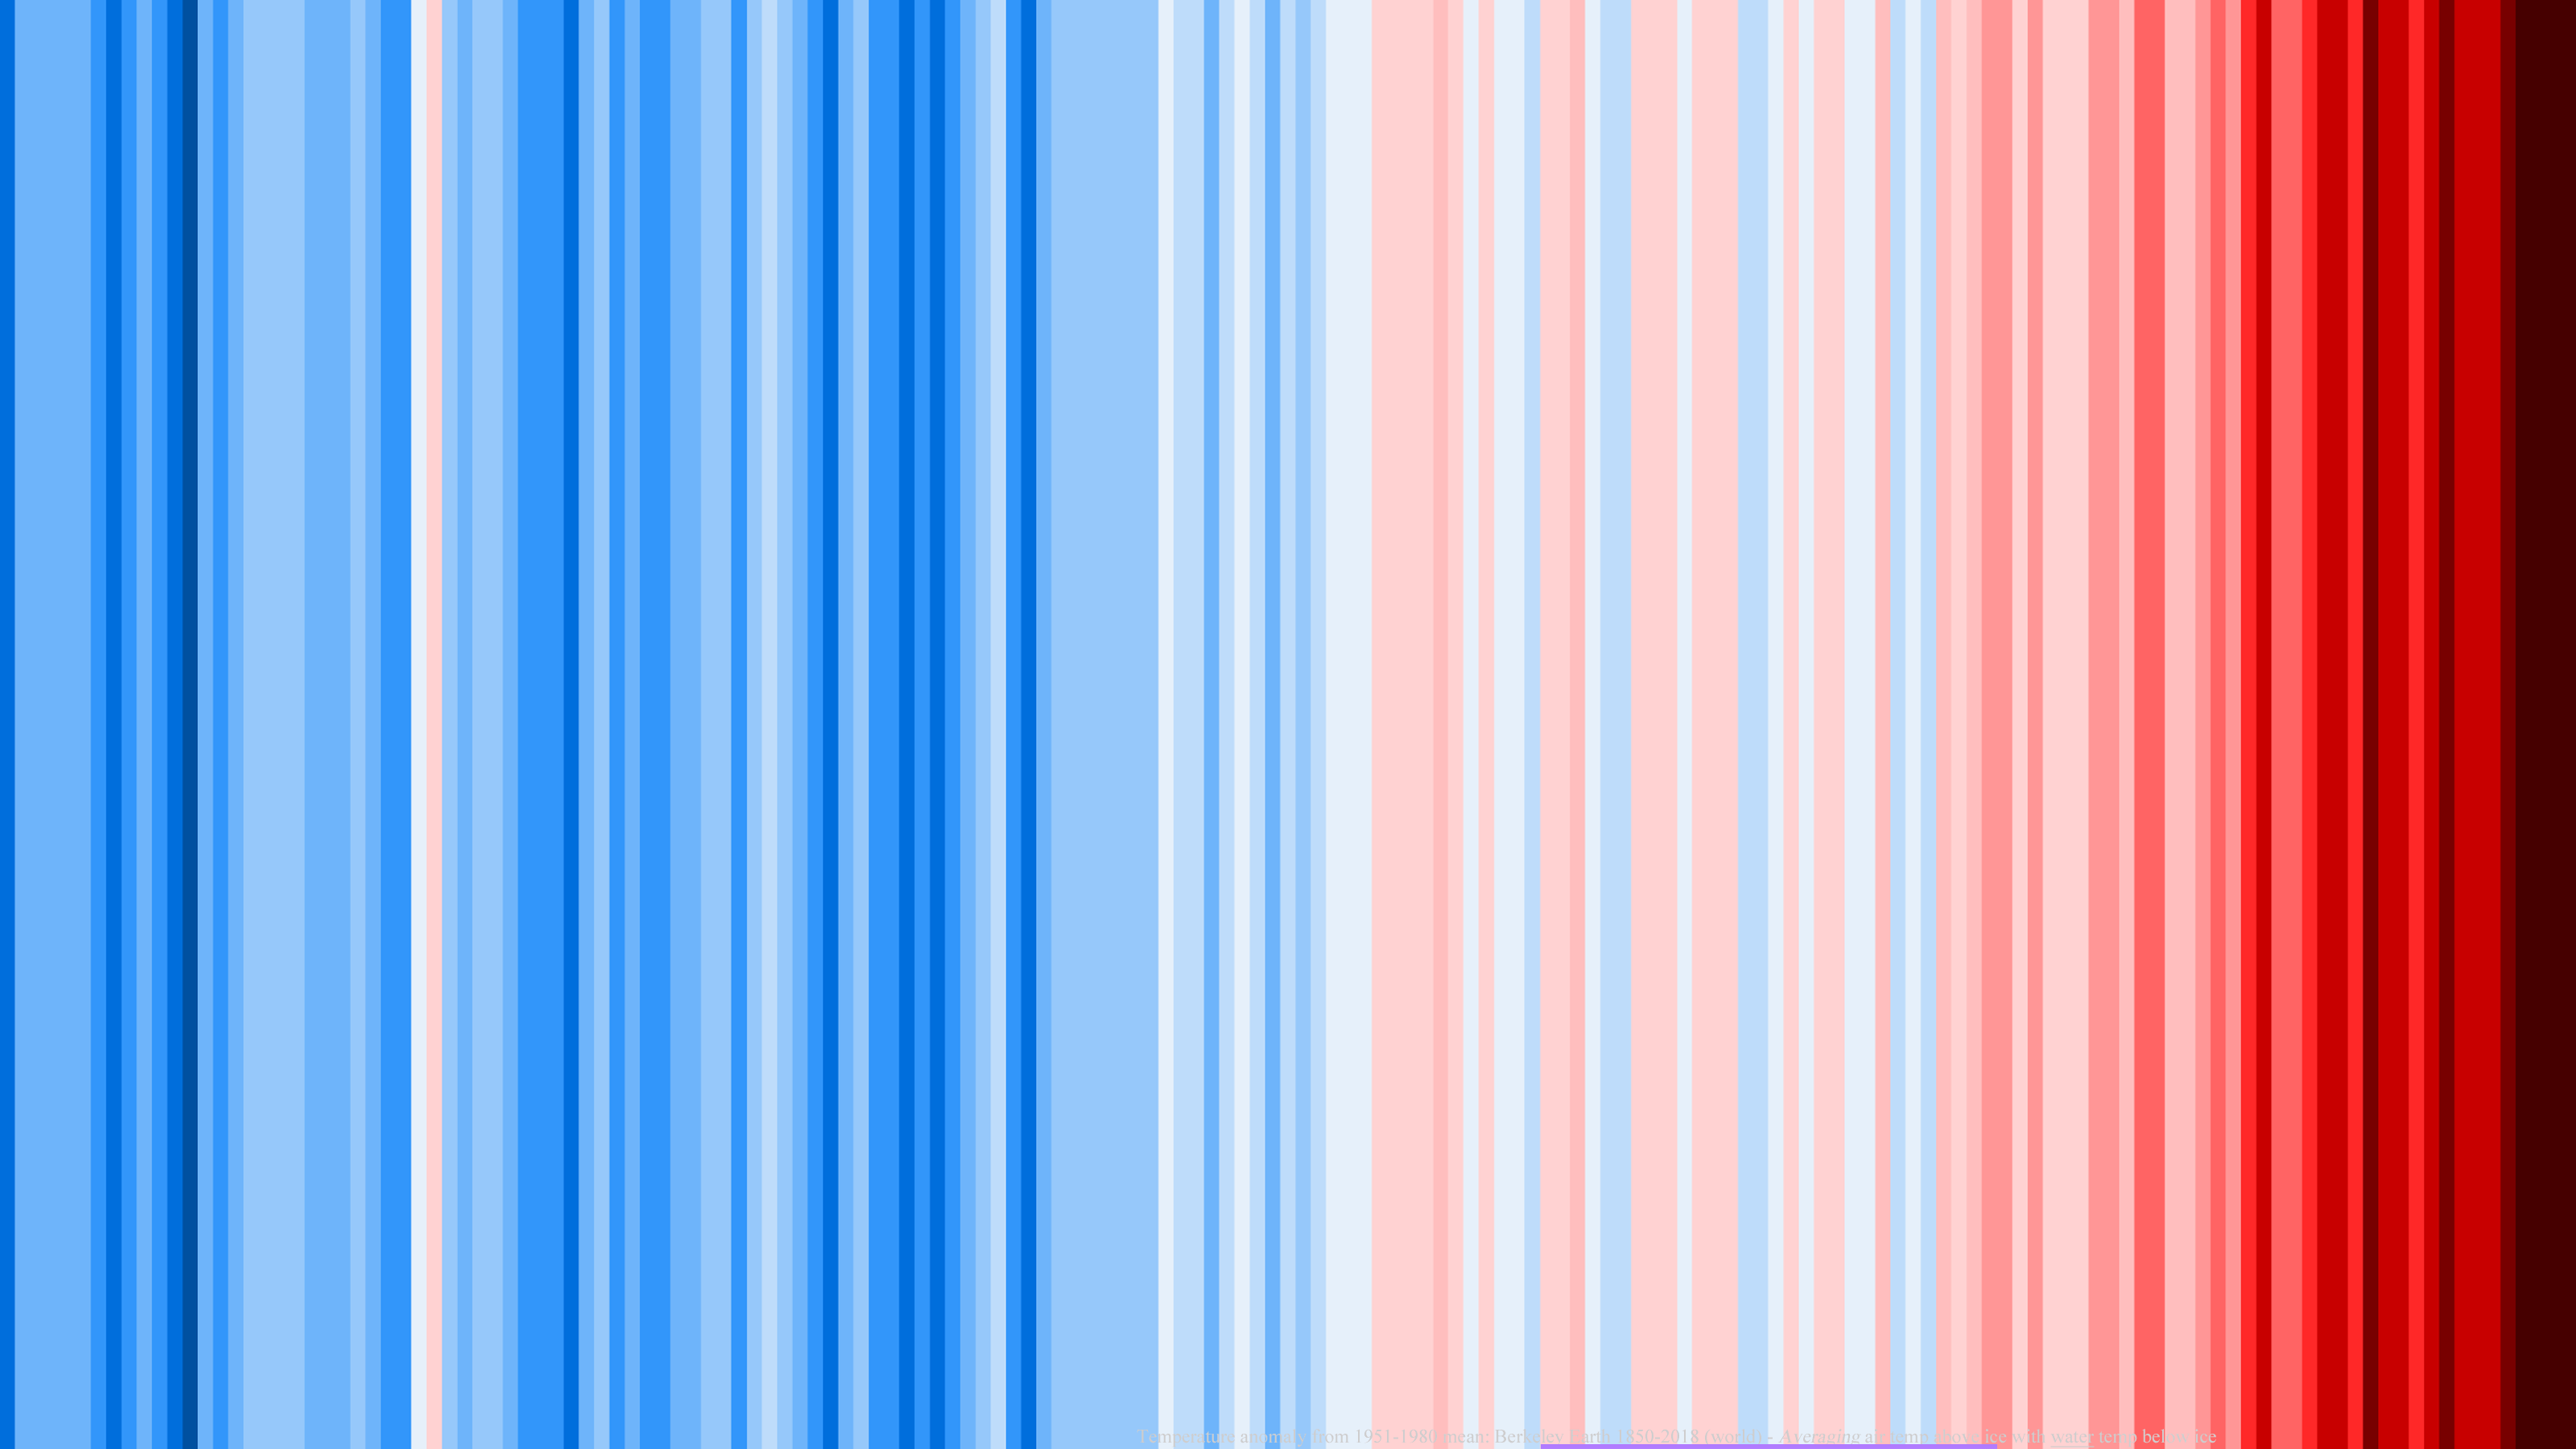
Description: w:Warming stripes w:data visualization diagram that represents temperature deviations above (in red stripes) and below (in blue stripes) a 1951-1980 mean value. General notes: Credit for general concept of w:warming stripes: climate scientist Ed Hawkins, w:University of Reading, U.K. Data values are visualized using color rather than locations of points on a graph. The average temperature in reference period 1951-1980 determines boundary between blue and red. Horizontal scale is time, from 1850 (left) to 2018 (right). Each hue (up to 8 blue and 8 red) covers a temperature range of 0.1 degrees Celsius. Data is global (not for a locality). Source documentation re the underlying data: http://berkeleyearth.lbl.gov/auto/Global/Land_and_Ocean_summary.txt https://web.archive.org/web/20190512213725/http://berkeleyearth.lbl.gov/auto/Global/Land_and_Ocean_summary.txt "This file contains a brief summary of the changes in Earth's global average surface temperature estimated by combining the Berkeley Earth land-surface temperature field with a reinterpolated version of the HadSST ocean temperature a field. Two versions of this average are reported. These differ in how they treat locations with sea ice. In the first version, temperature anomalies in the presence of sea ice are extrapolated from land-surface air temperature anomalies. In the second version, temperature anomalies in the presence of sea ice are extrapolated from sea-surface water temperature anomalies (usually collected from open water areas on the periphery of the sea ice). ... "Temperatures are in Celsius and reported as anomalies relative to the Jan 1951-Dec 1980 average. ... "The land component is based on 45756 time series with 18875309 monthly data points "The ocean component is based on 376898952 instantaneous water temperature observations" Other datasets at Berkeley Earth: http://berkeleyearth.org/data/ https://web.archive.org/web/20190629180117/http://berkeleyearth.org/data/ I found the dataset for this graphic by clicking through "annual summary" Land + Ocean (1850 – Recent) ... Monthly Global Average Temperature (annual summary) Creator/Uploader's remarks: This warming stripe graphic is based on the year-wise average of the two datasets described above (namely, when sea ice is present, measuring air temp above the ice and measuring water temp below the ice). I averaged the datasets year by year in Microsoft Excel, and separated the averaged values into categories with "cutoff" (boundary) temperatures being multiples of 0.1 degrees Celsius (a simple linear relation). I assembled color-coded rectangles in Microsoft Powerpoint, exported, and re-sized using Photoshop. My resulting warming stripes diagram differs from a well-publicized one (June 2019) published by Ed Hawkins because he may have used a different Berkeley Earth dataset than I did. Mine here is based on deviation from a 1951-1980 reference period average, whereas Hawkins' data used a 1971-2000 reference period (the mean value separates blue from red). My "cutoff" temperatures (which determine boundaries between adjacent color bands) may be different. I used a different color scheme. Click at right to show/hide ACTUAL DATA The data: Year Temperature Anomaly 1850 -0.5015 1851 -0.3845 1852 -0.3675 1853 -0.3950 1854 -0.3450 1855 -0.3120 1856 -0.4600 1857 -0.5895 1858 -0.4475 1859 -0.3895 1860 -0.4520 1861 -0.5480 1862 -0.6190 1863 -0.3980 1864 -0.4235 1865 -0.3235 1866 -0.2650 1867 -0.2535 1868 -0.2305 1869 -0.2610 1870 -0.3305 1871 -0.3505 1872 -0.3290 1873 -0.2930 1874 -0.3750 1875 -0.4025 1876 -0.4055 1877 -0.0305 1878 0.0560 1879 -0.2655 1880 -0.3240 1881 -0.2305 1882 -0.2755 1883 -0.3385 1884 -0.4830 1885 -0.4635 1886 -0.4925 1887 -0.5090 1888 -0.3255 1889 -0.2055 1890 -0.4780 1891 -0.3765 1892 -0.4200 1893 -0.4070 1894 -0.3935 1895 -0.3365 1896 -0.2340 1897 -0.2315 1898 -0.4215 1899 -0.2590 1900 -0.1550 1901 -0.2265 1902 -0.3545 1903 -0.4630 1904 -0.5040 1905 -0.3455 1906 -0.2710 1907 -0.4350 1908 -0.4645 1909 -0.5155 1910 -0.4900 1911 -0.5205 1912 -0.4370 1913 -0.3970 1914 -0.2275 1915 -0.1645 1916 -0.4025 1917 -0.5085 1918 -0.3540 1919 -0.2890 1920 -0.2740 1921 -0.2030 1922 -0.2955 1923 -0.2785 1924 -0.2700 1925 -0.2245 1926 -0.0770 1927 -0.1965 1928 -0.1785 1929 -0.3575 1930 -0.1490 1931 -0.0900 1932 -0.1260 1933 -0.3075 1934 -0.1730 1935 -0.2085 1936 -0.1580 1937 -0.0050 1938 -0.0040 1939 -0.0135 1940 0.0660 1941 0.0640 1942 0.0160 1943 0.0455 1944 0.1420 1945 0.0140 1946 -0.0520 1947 0.0235 1948 -0.0620 1949 -0.0940 1950 -0.1695 1951 0.0030 1952 0.0640 1953 0.1230 1954 -0.0655 1955 -0.1165 1956 -0.1855 1957 0.0675 1958 0.0725 1959 0.0395 1960 -0.0075 1961 0.0780 1962 0.0230 1963 0.0690 1964 -0.1930 1965 -0.1035 1966 -0.0350 1967 0.0005 1968 -0.0490 1969 0.0880 1970 0.0305 1971 -0.0980 1972 -0.0075 1973 0.1090 1974 -0.1205 1975 -0.0580 1976 -0.1630 1977 0.1250 1978 0.0050 1979 0.1015 1980 0.2040 1981 0.2395 1982 0.0460 1983 0.2315 1984 0.0595 1985 0.0515 1986 0.0990 1987 0.2350 1988 0.2740 1989 0.1590 1990 0.3485 1991 0.3260 1992 0.1590 1993 0.1820 1994 0.2435 1995 0.3665 1996 0.2595 1997 0.4250 1998 0.5610 1999 0.3305 2000 0.3420 2001 0.4915 2002 0.5605 2003 0.5515 2004 0.4675 2005 0.6185 2006 0.5620 2007 0.5750 2008 0.4575 2009 0.5780 2010 0.6430 2011 0.5235 2012 0.5455 2013 0.5865 2014 0.6435 2015 0.7860 2016 0.8940 2017 0.7870 2018 0.7205
Title: 20190705 Warming stripes - Berkeley Earth (world) - avg above- and below-ice readings
Credit: Own work
Author: RCraig09
Usage Terms: Creative Commons Attribution-Share Alike 4.0
License: CC BY-SA 4.0
License Link: https://creativecommons.org/licenses/by-sa/4.0
Attribution Required?: Yes
Image usage
The following page links to this image:

_-_avg_above-_and_below-ice_readings.png)