
Image: 2021 Death rates, by energy source

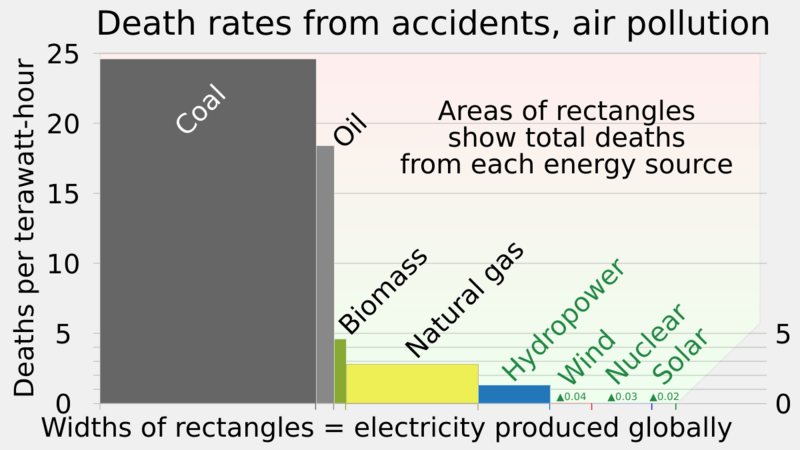
Description: Chart showing relation of death rates per unit of energy generated, total death rates, and energy produced globally, each as a function of energy type Source: What are the safest and cleanest sources of energy?. Our World in Data (2021). Archived from the original on 15 January 2024. Data sources: Markandya & Wilkinson (2007); UNSCEAR (2008; 2018); Sovacool et al. (2016); IPCC AR5 (2014); Pehl et al. (2017); Ember Energy (2021). Source explains: "Death rates from fossil fuels and biomass are based on state-of-the art plants with pollution controls in Europe, and are based on older models of the impacts of air pollution on health. This means these death rates are likely to be very conservative. ... Electricity shares are given for 2021." Technical note: most SVG code was automatically generated by the "Variable-width bar charts" spreadsheet linked at User:RCraig09/Excel to XML for SVG. Additions and adjustments were made in a text editor.
This SVG file contains embedded text that can be translated into your language, using any capable SVG editor, text editor or the SVG Translate tool. For more information see: About translating SVG files.
Author: RCraig09
Usage Terms: Creative Commons Attribution-Share Alike 3.0
License: CC-BY-SA-3.0
License Link: http://creativecommons.org/licenses/by-sa/3.0/
Attribution Required?: Yes
Image usage
The following page links to this image:
