
Image: Canadian ethnocultural diversity
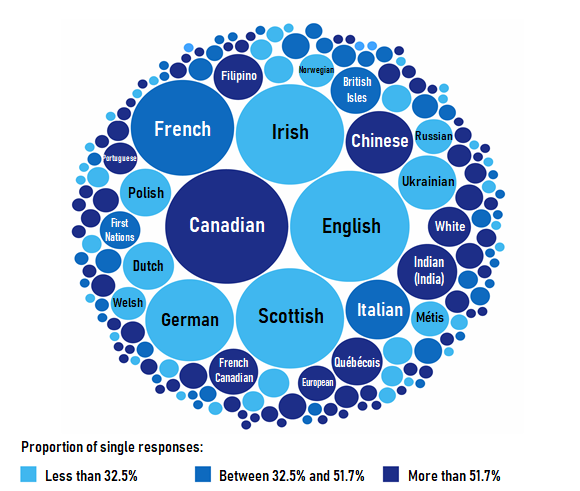
Description: This bubble chart comprises the 168 ethnic or cultural origins reported most often by Canadians in the 2021 Census. The size of the bubble is proportional to the number of total responses for a given ethnic or cultural origin. For bubbles that contain text, at least 1% of the Canadian population reported those origins. The origins presented are distributed into tertiles based on the proportion of single responses out of the total number of responses for a given ethnic or cultural origin. The lower tertile includes the origins reported least often with less than 32.5% as a single response, the upper tertile includes the origins reported most often with more than 51.7% as a single response, and the middle tertile includes the other ethnic or cultural origins reported between 32.5% and 51.7% as a single response. The "Canadian" ethnic or cultural origin represents 15.6% of total responses and is in the upper tertile of origins reported as a single response. The "English" ethnic or cultural origin represents 14.7% of total responses and is in the lower tertile of origins reported as a single response. The "Irish" ethnic or cultural origin represents 12.1% of total responses and is in the lower tertile of origins reported as a single response. The "Scottish" ethnic or cultural origin represents 12.1% of total responses and is in the lower tertile of origins reported as a single response. The "French" ethnic or cultural origin represents 11.0% of total responses and is in the middle tertile of origins reported as a single response. The "German" ethnic or cultural origin represents 8.1% of total responses and is in the lower tertile of origins reported as a single response. The "Chinese" ethnic or cultural origin represents 4.7% of total responses and is in the upper tertile of origins reported as a single response. The "Italian" ethnic or cultural origin represents 4.3% of total responses and is in the middle tertile of origins reported as a single response. The "Indian (India)" ethnic or cultural origin represents 3.7% of total responses and is in the upper tertile of origins reported as a single response. The "Ukrainian" ethnic or cultural origin represents 3.5% of total responses and is in the lower tertile of origins reported as a single response. The "Québécois" ethnic or cultural origin represents 2.7% of total responses and is in the upper tertile of origins reported as a single response. The "Dutch" ethnic or cultural origin represents 2.7% of total responses and is in the lower tertile of origins reported as a single response. The "Polish" ethnic or cultural origin represents 2.7% of total responses and is in the lower tertile of origins reported as a single response. The "British Isles" ethnic or cultural origin represents 2.6% of total responses and is in the middle tertile of origins reported as a single response. The "Filipino" ethnic or cultural origin represents 2.5% of total responses and is in the upper tertile of origins reported as a single response. The "French Canadian" ethnic or cultural origin represents 2.5% of total responses and is in the upper tertile of origins reported as a single response. The "White" ethnic or cultural origin represents 1.9% of total responses and is in the upper tertile of origins reported as a single response. The "First Nations (North American Indian)" ethnic or cultural origin represents 1.7% of total responses and is in the middle tertile of origins reported as a single response. The "European" ethnic or cultural origin represents 1.5% of total responses and is in the upper tertile of origins reported as a single response. The "Métis" ethnic or cultural origin represents 1.5% of total responses and is in the lower tertile of origins reported as a single response. The "Russian" ethnic or cultural origin represents 1.5% of total responses and is in the lower tertile of origins reported as a single response. The "Norwegian" ethnic or cultural origin represents 1.3% of total responses and is in the lower tertile of origins reported as a single response. The "Welsh" ethnic or cultural origin represents 1.3% of total responses and is in the lower tertile of origins reported as a single response. The "Portuguese" ethnic or cultural origin represents 1.2% of total responses and is in the upper tertile of origins reported as a single response. Note(s): The size of the bubble is proportional to the number of total responses for a given ethnic or cultural origin. The colour of the bubble corresponds to the proportion of single responses for a given ethnic or cultural origin grouped into tertiles. All citizens of Canada are classified as "Canadians" as defined by Canada's nationality law. "Canadian" as an ethnic group has since 1996 been added to census questionnaires for possible ancestral origin or descent. "Canadian" was included as an example on the English questionnaire and "Canadien" as an example on the French questionnaire.(2013) Accounting for Ethnic and Racial Diversity: The Challenge of Enumeration, Routledge, pp. 48–49 ISBN: 978-1-317-98108-4.
"The majority of respondents to this selection are from the eastern part of the country that was first settled. Respondents generally are visibly European (Anglophones and Francophones) and no longer self-identify with their ethnic ancestral origins. This response is attributed to a multitude or generational distance from ancestral lineage."(2016) Rethinking Society in the 21st Century (4th ed.), Canadian Scholars' Press, pp. 455–456 ISBN: 978-1-55130-936-1. (2011) The Changing Canadian Population, McGill-Queen's University Press, pp. 294–296 ISBN: 978-0-7735-3793-4.
Author: Statistics Canada
Usage Terms: Creative Commons Attribution-Share Alike 3.0
License: CC-BY-SA-3.0
License Link: http://creativecommons.org/licenses/by-sa/3.0/
Attribution Required?: Yes
Image usage
The following page links to this image:
