
Image: Cartogram-2008 Electoral Vote
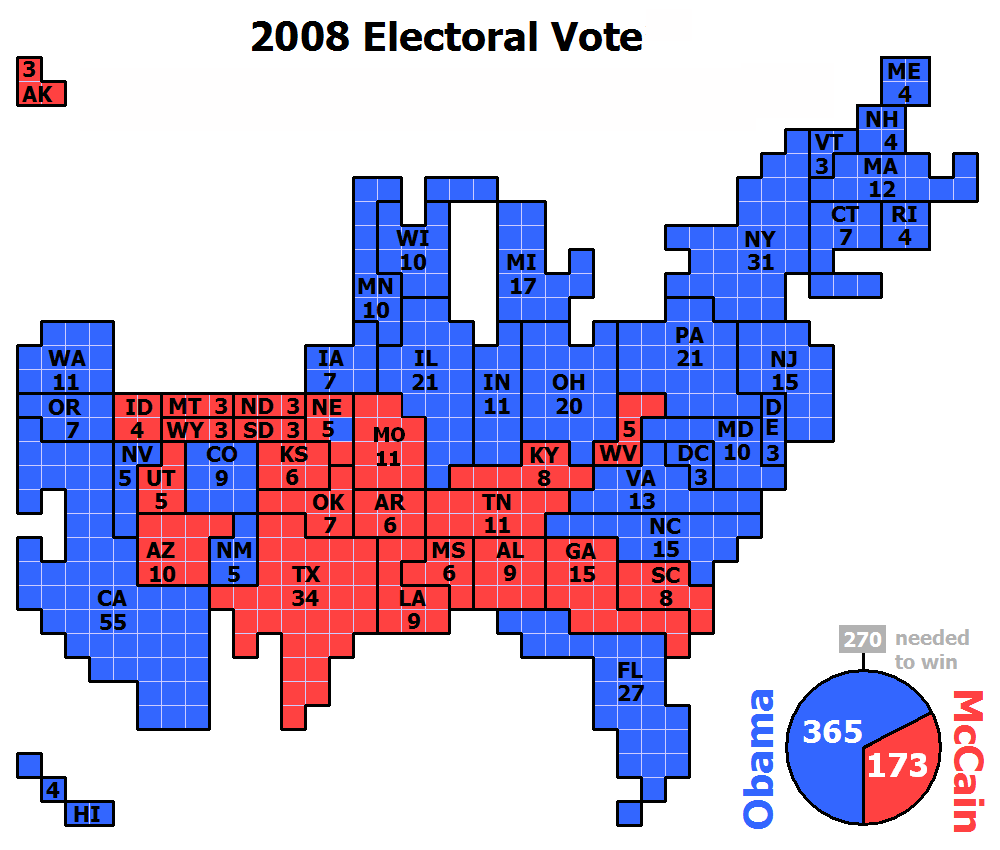
Description: Cartogram of the 2008 Electoral Vote for US President, with each square representing one electoral vote. Nebraska, being one of two states that are not winner-take-all, for the first time had its votes split, with NE-2 voting for Obama and the rest of the state for McCain. The population density of the 50 states varies by three orders of magnitude (from NJ with nearly 1,200 people per square mile, to AK with roughly 1 1/4 people per sq mi). Because of that huge variation, a regular map of the US that is typically used to present electoral vote results can convey a very skewed impression of the outcome where sparsely populated states appear overrepresented and densely populated states appear underrepresented. The cartogram approach of this image eliminates that problem by presenting the area of each state in an exact one-to-one correspondence with its number of electoral votes. But this is achieved at the cost of introducing distortions to the actual shape of each state and their positioning in relation to each other.
Title: Cartogram-2008 Electoral Vote
Credit: Own work by uploader (created with Powerpoint)
Author: ChrisnHouston
Usage Terms: Creative Commons Attribution-Share Alike 3.0
License: CC BY-SA 3.0
License Link: http://creativecommons.org/licenses/by-sa/3.0
Attribution Required?: Yes
Image usage
The following page links to this image:
