
Image: Celia 1970 track

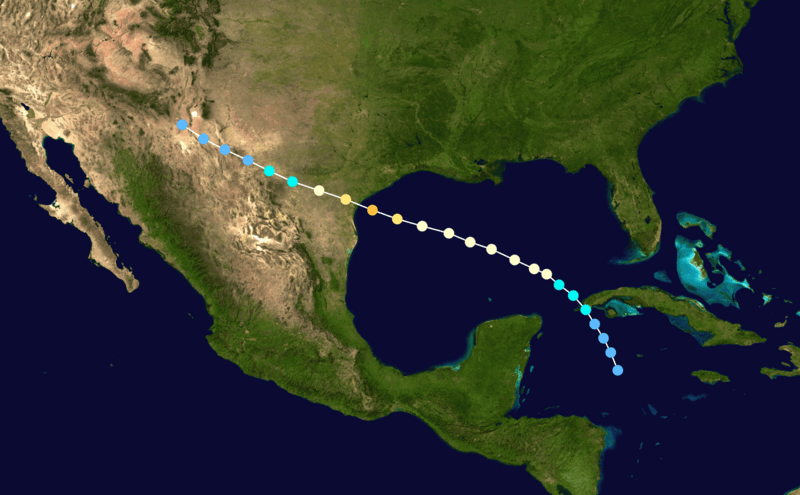
Description: Track map of Hurricane Celia of the 1970 Atlantic hurricane season. The points show the location of the storm at 6-hour intervals. The colour represents the storm's maximum sustained wind speeds as classified in the Saffir–Simpson scale (see below), and the shape of the data points represent the nature of the storm, according to the legend below. Saffir–Simpson scale .mw-parser-output .div-col{margin-top:.3em;column-width:30em}.mw-parser-output .div-col-small{font-size:90%}.mw-parser-output .div-col-rules{column-rule:1px solid #aaa}.mw-parser-output .div-col dl,.mw-parser-output .div-col ol,.mw-parser-output .div-col ul{margin-top:0}.mw-parser-output .div-col li,.mw-parser-output .div-col dd{page-break-inside:avoid;break-inside:avoid-column} Tropical depression (≤38 mph, ≤62 km/h) Tropical storm (39–73 mph, 63–118 km/h) Category 1 (74–95 mph, 119–153 km/h) Category 2 (96–110 mph, 154–177 km/h) Category 3 (111–129 mph, 178–208 km/h) Category 4 (130–156 mph, 209–251 km/h) Category 5 (≥157 mph, ≥252 km/h) Unknown Storm type Tropical cyclone Subtropical cyclone Extratropical cyclone / Remnant low / Tropical disturbance / Monsoon depression
Title: Celia 1970 track
Credit: Created by Jdorje using WikiProject Tropical cyclones/Tracks. The background image is from NASA. Tracking data is from the National Hurricane Center[1].
Author: Jdorje
Usage Terms: Public domain
License: Public domain
Attribution Required?: No
Image usage
The following page links to this image:
