
Image: Covid-19 UK variant odds ratio curves by region
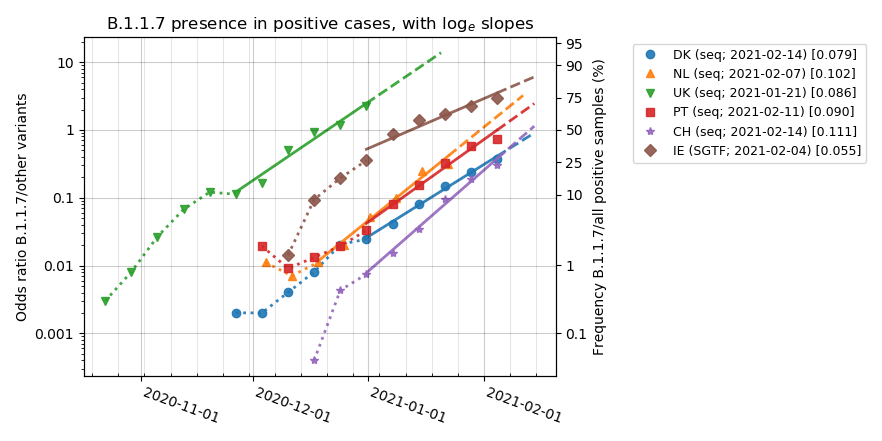
Description: The odds ratio (left y axis) of B.1.1.7 versus 'wild' variants is expected to grow exponentially; [0.076] means 7.9% growth per day. Dataset dates are publication dates. 'seq' for data from genomic sequnecing; 'SGTF' for PCR-based data (S-Gene Target Failure; less accurate than sequencing). To convert the log slope s to ratios of R values: exp(s*Tg) with Tg the generation interval (usually assumed 4–6 days). Data sources: DK[1], NL[2][3][4], PT[5], CH[6], UK[7], IE[8][9]. Note that the logarithmic slopes as indicated are not based on a rigorous uncertainty analysis. Code to generate these graphs: Github/han-kwang.
Title: Covid-19 VOC-202012-01 odds ratio curves by country
Credit: Own work
Author: Hankwang
Usage Terms: Creative Commons Attribution-Share Alike 4.0
License: CC BY-SA 4.0
License Link: https://creativecommons.org/licenses/by-sa/4.0
Attribution Required?: Yes
Image usage
The following page links to this image:
