
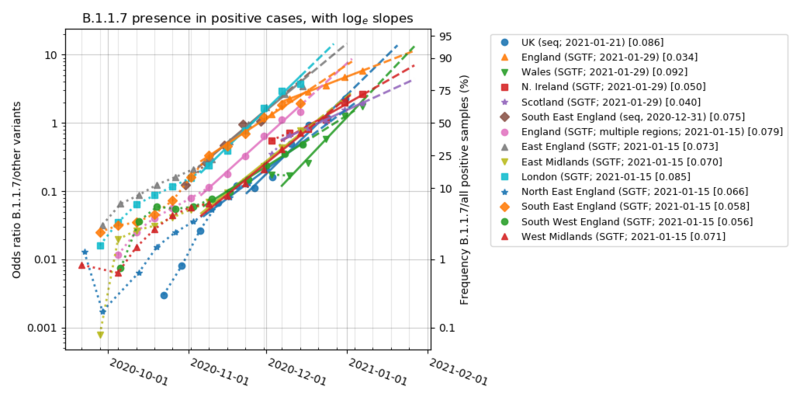
Image: Covid-19 VOC-202012-01 odds ratio curves by UK region

Description: The odds ratio (left y axis) of B.1.1.7 versus 'wild' variants is expected to grow exponentially; [0.076] means 7.9% growth per day. Dataset dates are publication dates. 'seq' for data from genomic sequnecing; 'SGTF' for PCR-based data (S-Gene Target Failure; less accurate than sequencing). To convert the log slope s to ratios of R values: exp(s*Tg) with Tg the generation interval (usually assumed 4–6 days). The SGTF data is based on population sampling; shifted by 14 days to estimate the day of symptom onset. A background positive rate is subtracted for the 2021-01-15 data. Data sources: UK national (2021-01-21)[1]; South-East England (2020-12-31)[2]; UK countries (2021-01-29)[3]; England regions (2021-01-15)[4]
Title: Covid-19 VOC-202012-01 odds ratio curves by UK region
Credit: Own work
Author: Hankwang
Usage Terms: Creative Commons Attribution-Share Alike 4.0
License: CC BY-SA 4.0
License Link: https://creativecommons.org/licenses/by-sa/4.0
Attribution Required?: Yes
Image usage
The following page links to this image:
