
Image: Distribution of Manufacturing between Two Regions
No higher resolution available.
Distribution_of_Manufacturing_between_Two_Regions.png (592 × 339 pixels, file size: 5 KB, MIME type: image/png)
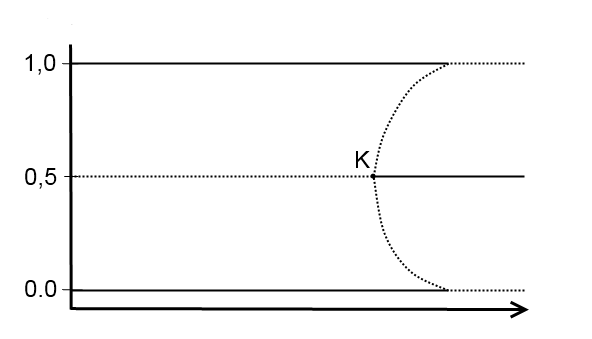
Description: The figure illustrates Krugman’s ‘core-periphery’ model. The horizontal axis represents costs of trade between the two regions. The vertical axis represents the share of either region in manufacturing. Solid lines on the graph denote stable equilibria. Dashed lines denotes unstable equilibria. K is a critical (bifurcation) point.
Title: Distribution of Manufacturing between Two Regions
Credit: Own work
Author: Ростислав Кирилл Владимирович
Usage Terms: Creative Commons Attribution-Share Alike 3.0
License: CC BY-SA 3.0
License Link: http://creativecommons.org/licenses/by-sa/3.0
Attribution Required?: Yes
Image usage
The following page links to this image:

All content from Kiddle encyclopedia articles (including the article images and facts) can be freely used under Attribution-ShareAlike license, unless stated otherwise.