
Image: Eurozone Countries Public Debt to GDP Ratio 2010 vs. 2011

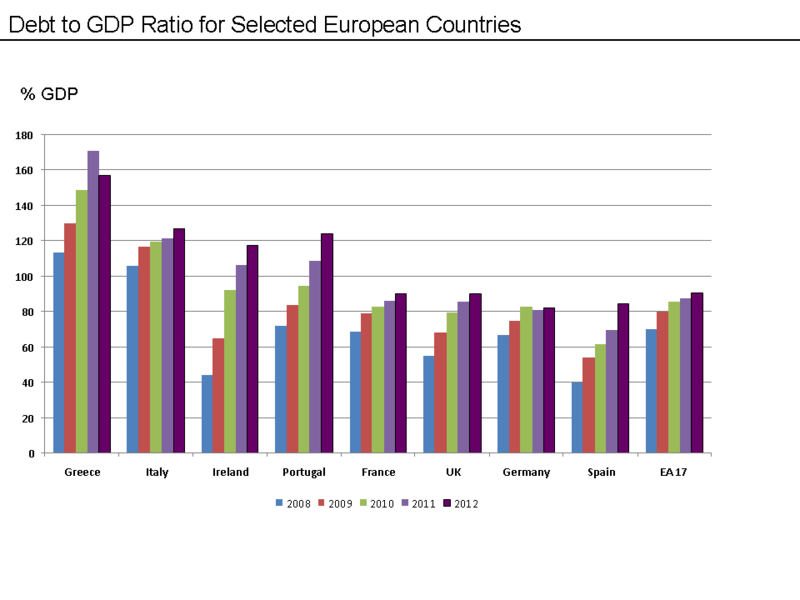
Description: This chart compares the debt to gdp ratio (%) for selected Eurozone countries in 2010 and 2011 Understanding the chart Note: This chart was updated with 2012 data on May 13, 2013. Understanding the chart The "Public debt to GDP ratio" is calculated as public debt divided by GDP. These figures are provided by Eurostat for each country. Public debt is money owed to investors by the government. It does not include private debts owed by individuals or corporations. An increase in the debt to GDP ratio indicates the country is carrying more debt relative to the size of its economy, which is considered an unfavorable trend. All of the countries presented consistently increased their debt to GDP ratio during the 2008-2012 period, except Germany, which was able to hold its ratio relatively constant since 2010. Note: The UK does not use the Euro as its currency. It is included for comparison. The EA17 refers to the seventeen countries that use the Euro as their currency. Source data Eurostat published this information with comparative data by country from 2008-2012.[1][2][3] Implications of rising debt to GDP ratios In nearly every country except Germany, the debt to GDP ratio has risen since 2008,indicating a worsening overall fiscal position. Understanding the math While not shown in this chart, many of the Eurozone countries reduced their budget deficits from 2010 to 2011. So why the increase in the debt to GDP ratio? If during a given year, the: a) ratio of the Euro deficit to Euro change in GDP is less than the b) ratio of debt to GDP in the starting year, the debt to GDP ratio will decline. Stated as an expression, if (Deficit / Change in GDP) < (Public debt / GDP in initial year), the ratio will decline, which is considered an improvement in the fiscal position. Using an example, let's say a country's debt to GDP ratio in year 1 is 110% = 110 Debt / 100 GDP. Then, debt rises by 8 but GDP rises by 10 from year 1 to year 2, a ratio of 80%. The year 2 debt to GDP ratio is 118 / 110 = 107%, an improvement. Using the same starting point, if debt increased by 12 but GDP rose by 10, a ratio of 120%, the new debt to GDP ratio is 122/110 or 111%.
Title: Eurozone Countries Public Debt to GDP Ratio 2010 vs. 2011
Credit: Eurostat Previously published: None
Author: Farcaster
Usage Terms: Creative Commons Attribution-Share Alike 3.0
License: CC BY-SA 3.0
License Link: http://creativecommons.org/licenses/by-sa/3.0
Attribution Required?: Yes
Image usage
The following 2 pages link to this image:
