
Image: GDP by U.S. state

Size of this PNG preview of this SVG file: 800 × 396 pixels. Other resolution: 320 × 158 pixels.
Original image (SVG file, nominally 1,199 × 593 pixels, file size: 71 KB)
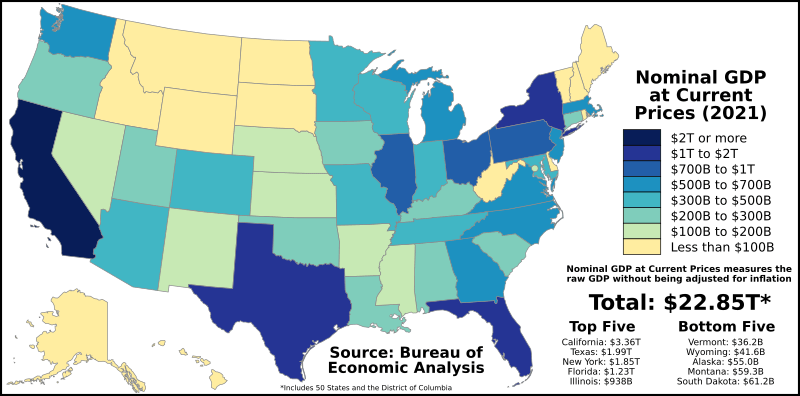
Description: The map above shows the Nominal GDP (at current prices) of each U.S. state and the District of Columbia as of the latest full-year official estimates, which are currently the U.S. Bureau of Economic Statistics' Annual 2021 GDP data. They can be found here. Legend $2T or more $1T to $2T $700B to $1T $500B to $700B $300B to $500B $200B to $300B $100B to $200B Less than $100B
Title: GDP by U.S. state
Credit: Own work
Author: Abbasi786786
Usage Terms: Creative Commons Attribution-Share Alike 4.0
License: CC BY-SA 4.0
License Link: https://creativecommons.org/licenses/by-sa/4.0
Attribution Required?: Yes
Image usage
There are no pages that link to this image.

All content from Kiddle encyclopedia articles (including the article images and facts) can be freely used under Attribution-ShareAlike license, unless stated otherwise.