
Image: Global-soy-production-to-end-use

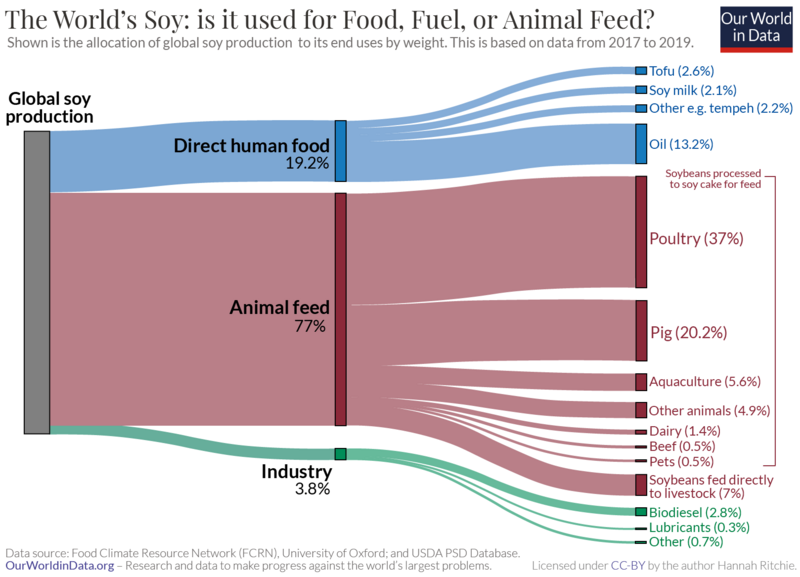
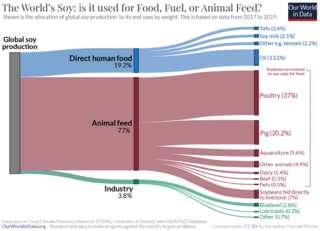
Description: More than three-quarters of global soy is fed to animals Before we look at the evidence for whether Brazilian soy is responsible for the clearing of the Amazon, we should first understand what products have been driving this growth. When someone mentions soy we often think about foods such as tofu, soy milk, tempeh or edamame beans. This feeds into the argument that meat and dairy substitutes – such as switching from meat to high-protein tofu, or from dairy to soy milk – is in fact worse for the environment. But, only a small percentage of global soy is used for these products. More than three-quarters (77%) of soy is used as feed for livestock. In the chart here we see the breakdown of what the world’s soy was used for in 2018. On the left we have total global soy production; in the middle, the three categories of uses (direct human food, animal feed, and industrial processes); and on the right we have the end use products. This data is sourced from an analysis published by the University of Oxford’s Food Climate Research Network (FCRN), which relies on the USDA’s PSD database.3 Over one-third (37%) of global soy is fed to chickens and other poultry; one-fifth to pigs; and 6% for aquaculture. Very little soy is used for beef and dairy production – only 2%. One-fifth of the world’s soy is used for direct (i.e. not from meat and dairy) human consumption. Most of this is first processed into soybean oil. Typical soy products such as tofu, soy milk, tempeh and edamame beans account for just 7% of global demand. Soy can also be used for industrial purposes. Around 4% is used for biofuels, lubricants and other industrial processes. Biodiesel alone accounts for 2.8%. Global soy production to end use We might therefore conclude that the increased demand for soy has been driven by a growing appetite for meat, dairy and soybean oil. But to double-check we should look beyond this static single-year view and see how demand has changed over time. Maybe demand for these products has always been high, and instead the growth in demand has come from the increased popularity of products such as soy milk and tofu. In the chart we see the allocation of soybeans to three categories. Processed products include all animal feed from soybean cake (i.e. 70% of global demand); soybean oil; and industrial products such as biofuels. Direct human food includes all non-animal-sourced foods from soy excluding oils. Direct animal feed is soybeans fed directly to livestock (rather than been processed into soybean cake first). We see that most of this growth has come from the increased demand for processed soy – animal feed, biofuels and vegetable oil. This rise has been particularly steep since 1990. By 2013, it had increased from 88 million to 227 million tonnes. Over this period, demand for human food products such as tofu and soy milk increased by only 3 million tonnes (from 7.4 to 10.7 million). This should not surprise us. Global meat production has more than tripled over the last 50 years. This increase has been most marked for poultry – the largest consumer of soy feed. Using the ‘change country’ toggle you can see how this allocation varies by country. For example, we see that this distribution is similar for Brazil.
Title: Global-soy-production-to-end-use
Credit: https://ourworldindata.org/soy
Author: Hannah Ritchie and Max Roser
Usage Terms: Creative Commons Attribution-Share Alike 4.0
License: CC BY-SA 4.0
License Link: https://creativecommons.org/licenses/by-sa/4.0
Attribution Required?: Yes
Image usage
The following page links to this image:
