
Image: Graph of monthly temperature variations in south-west England

Size of this preview: 800 × 415 pixels. Other resolutions: 320 × 166 pixels | 1,568 × 813 pixels.
Original image (1,568 × 813 pixels, file size: 203 KB, MIME type: image/png)
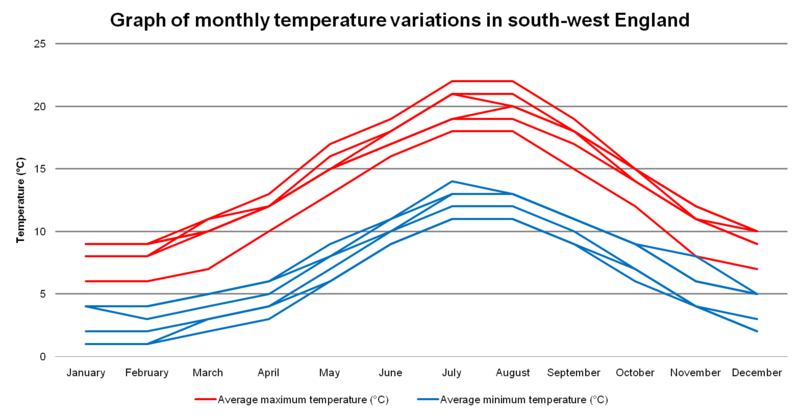
Description: A line graph plotting the average monthly minimum and maximum temperatures recorded at eight weather stations across South West England during 1971-2001: Bude, Nettlecombe, Princetown, St. Mawgan, Teignmouth and Yeovilton.
Title: Graph of monthly temperature variations in south-west England
Credit: Own work in Microsoft Excel using the following data from the Met Office: Bude Nettlecombe Princetown St. Mawgan Teignmouth Yeovilton
Author: Jolly Janner
Usage Terms: Public domain
License: Public domain
Attribution Required?: No
Image usage
The following page links to this image:

All content from Kiddle encyclopedia articles (including the article images and facts) can be freely used under Attribution-ShareAlike license, unless stated otherwise.