
Image: Graph showing population changes in Great Henny
No higher resolution available.
Graph_showing_population_changes_in_Great_Henny.png (484 × 307 pixels, file size: 8 KB, MIME type: image/png)
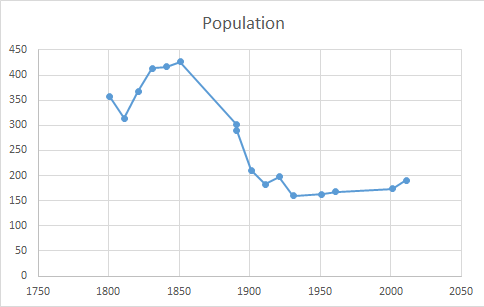
Description: A scatter graph showing how the population of Great Henny, Essex, has changed using census data from 1861-2011.
Title: Graph showing population changes in Great Henny
Credit: http://www.neighbourhood.statistics.gov.uk/dissemination/LeadKeyFigures.do?a=7&b=11123922&c=Great+Henny&d=16&e=62&g=6423029&i=1001x1003x1032x1004&m=0&r=1&s=1429798025683&enc=1
Author: Neighborhood Statistics
Usage Terms: Public domain
License: Public domain
Attribution Required?: No
Image usage
The following page links to this image:

All content from Kiddle encyclopedia articles (including the article images and facts) can be freely used under Attribution-ShareAlike license, unless stated otherwise.