
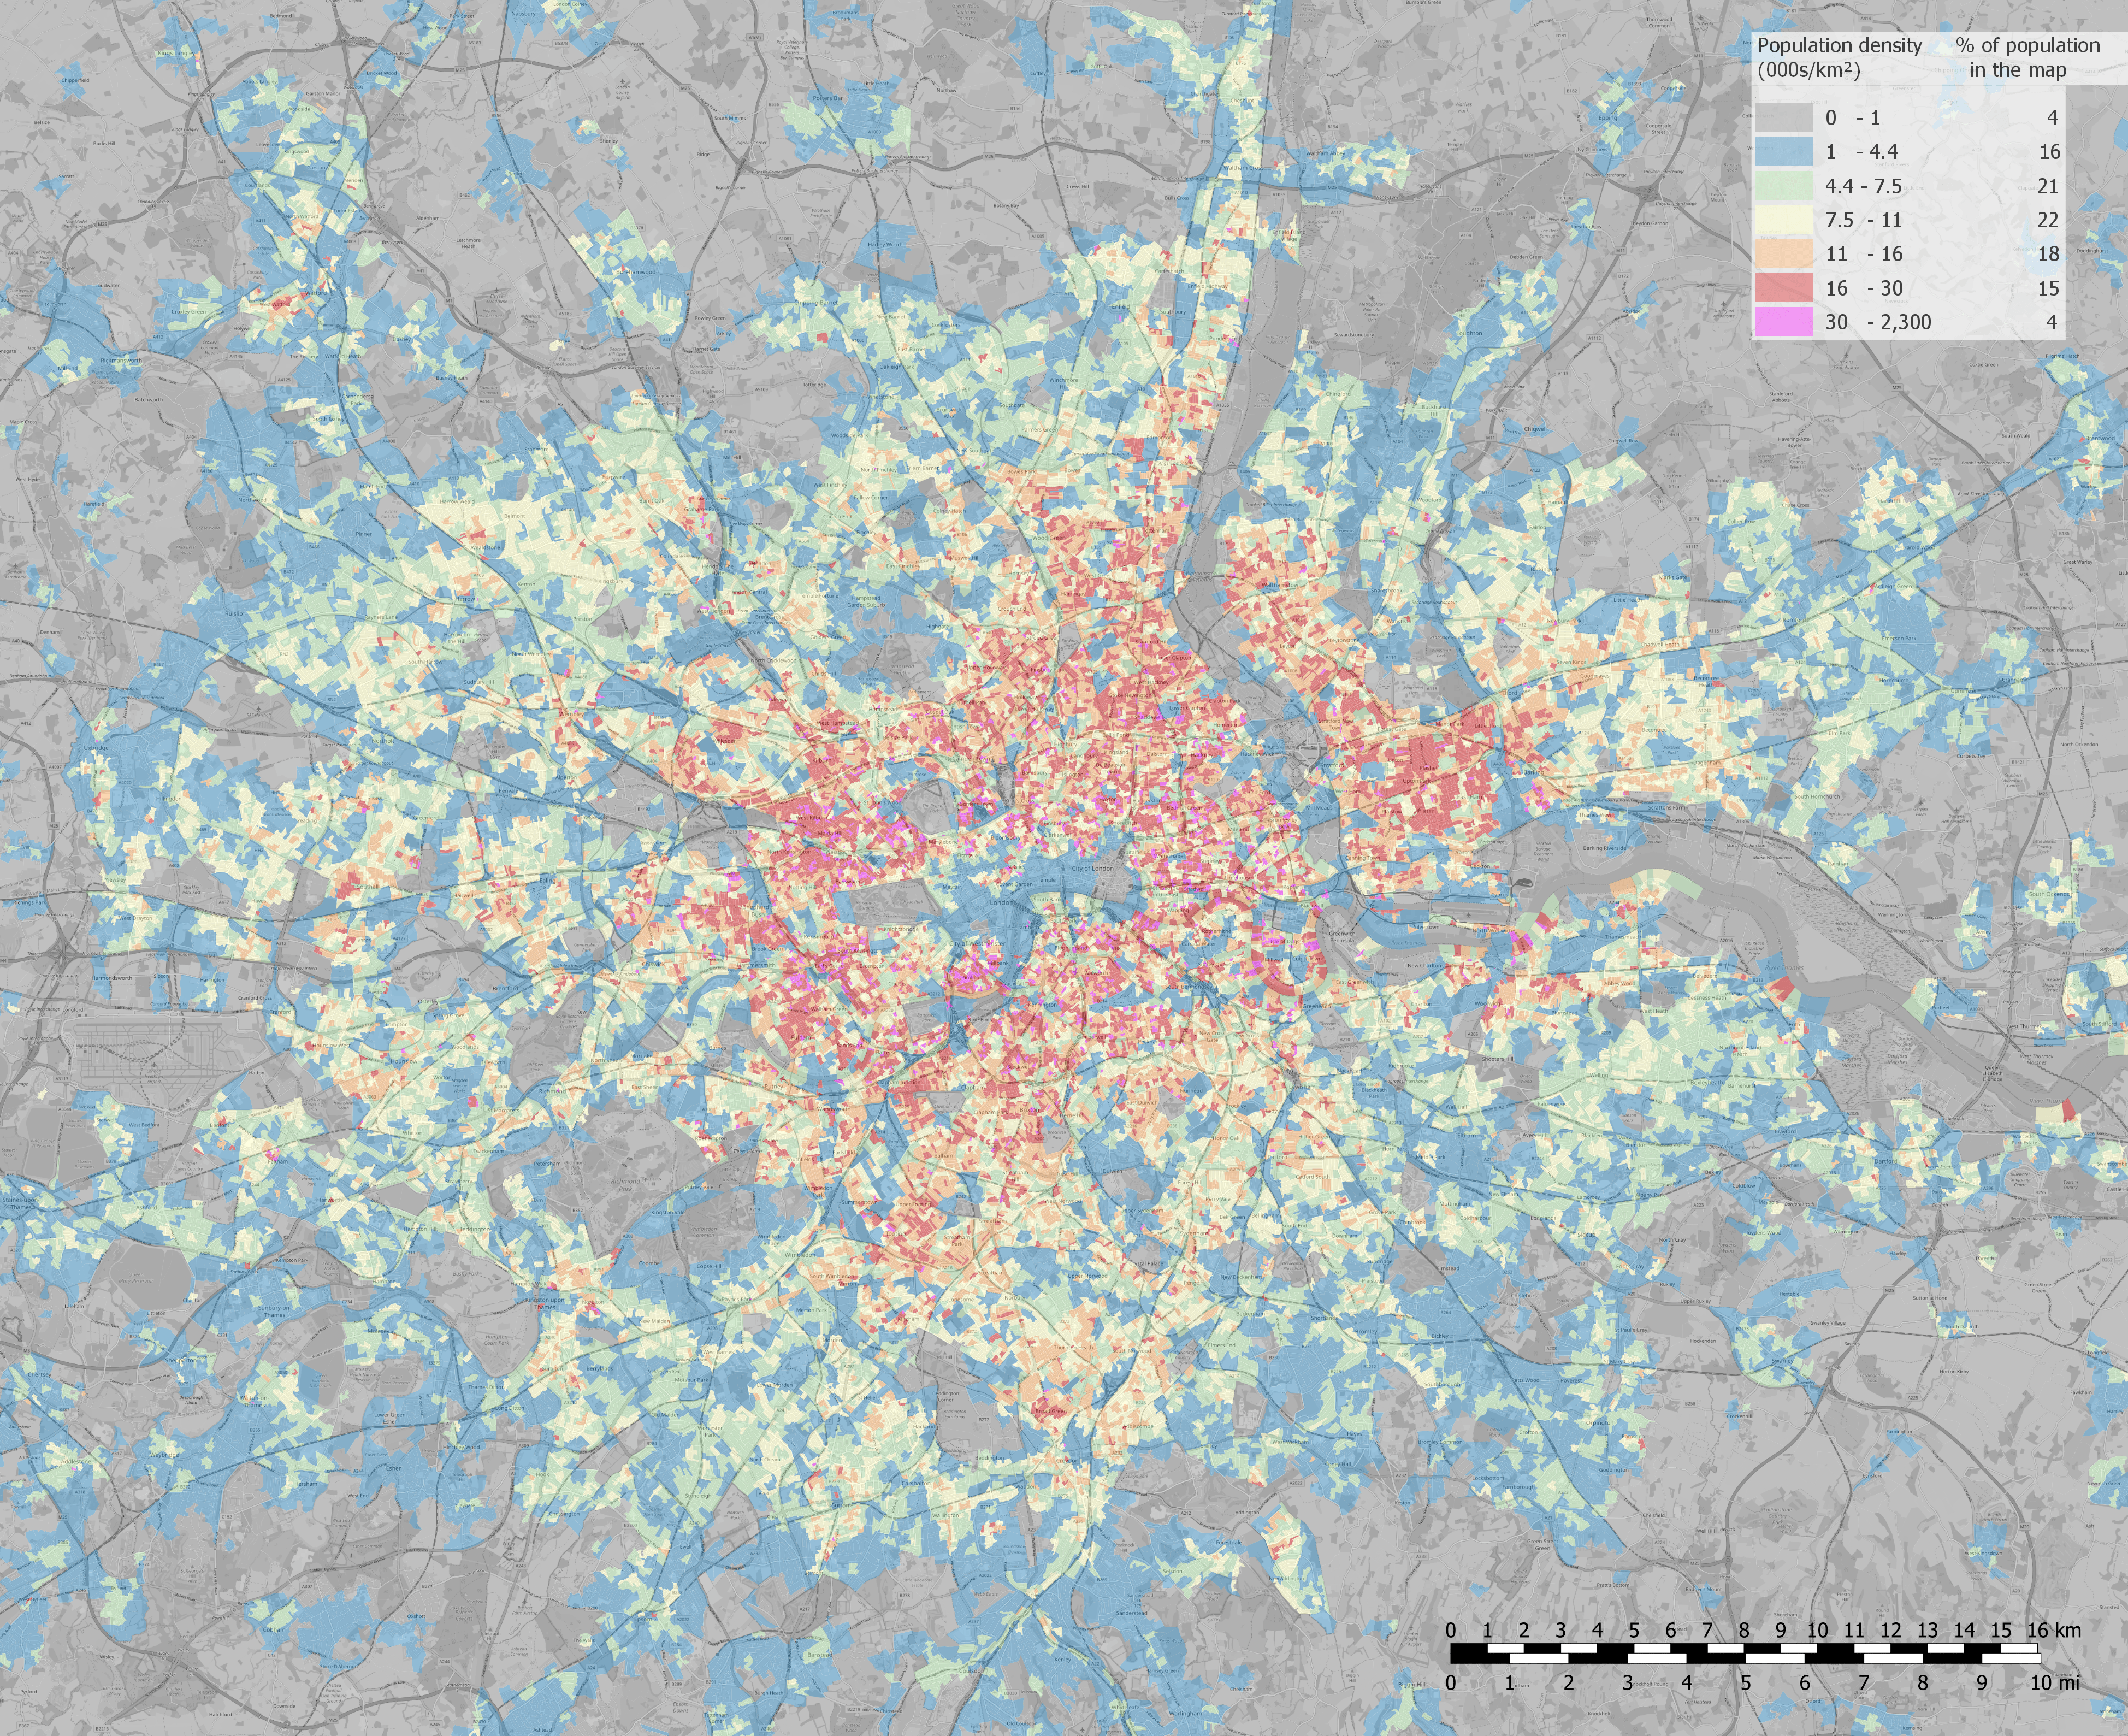
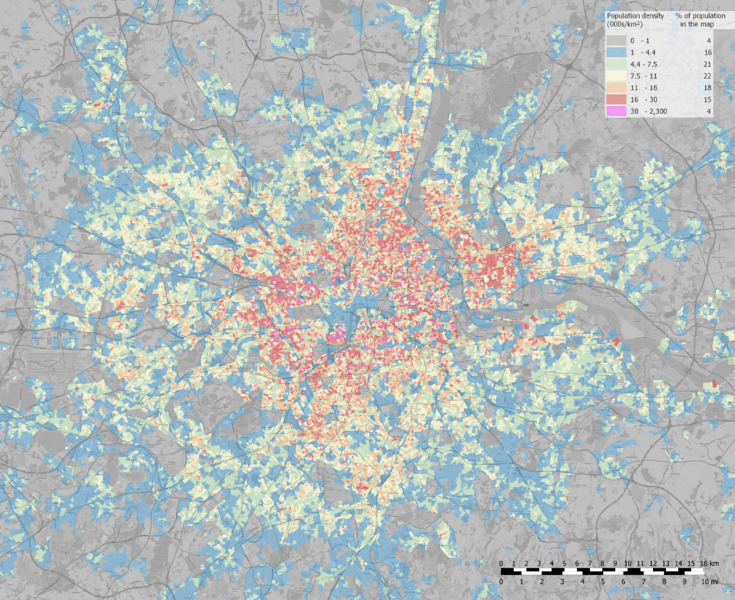
Image: Greater London population density map, 2011 census
Description: The map area was inhabited by 9.4 mln people in 2011 and shows most of Greater London Built-up Area (9.8 mln people in 2011) and some areas outside it. Population density computed from 2011 Output Area (OE) data there is on 2020 map so new neighbourhoods are visible in the grey zone. Values sometimes are not representative because: sometimes a whole nonresidential area is contained in one from a few adjacent OEs. sometimes OEs encompass only building, sometimes only part of it, to keep up stiff household count limit, what gives very high density. OE boundaries are visible, especially in red and pink.
Title: Greater London population density map, 2011 census
Credit: Own work based on: OpenStreetMap. Boundaries: Office for National Statistics (2011). 2011 Census: boundary data (England and Wales) [data collection]. UK Data Service. SN:5819 UKBORDERS: Digitised Boundary Data, 1840- and Postcode Directories, 1980-. http://discover.ukdataservice.ac.uk/catalogue/?sn=5819&type=Data%20catalogue, Retrieved from http://census.ukdataservice.ac.uk/get-data/boundary-data.aspx. Contains public sector information licensed under the Open Government Licence v3. Density values: Office for National Statistics ; National Records of Scotland ; Northern Ireland Statistics and Research Agency (2017): 2011 Census aggregate data. UK Data Service (Edition: February 2017). DOI: http://dx.doi.org/10.5257/census/aggregate-2011-2 This information is licensed under the terms of the Open Government Licence [1].
Author: PawełS
Usage Terms: Creative Commons Attribution-Share Alike 2.0
License: CC BY-SA 2.0
License Link: https://creativecommons.org/licenses/by-sa/2.0
Attribution Required?: Yes
Image usage
The following page links to this image:
