
Image: HATS Nitrous Oxide concentration
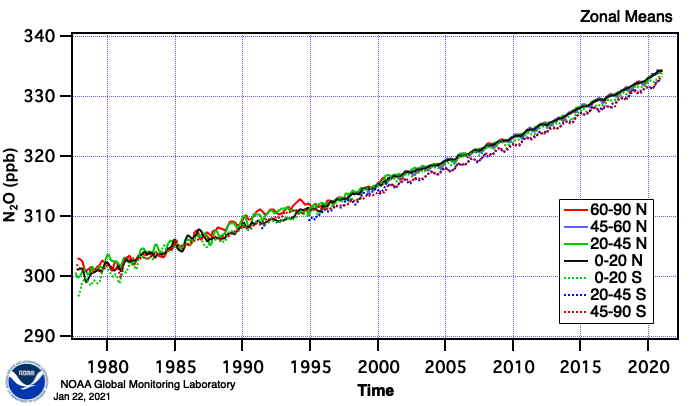
Description: Graph shows the concentration of nitrous oxide ( N2O) in earth's atmosphere versus time and latitude. X-axis data interval is monthly. Y-axis concentration is parts per billion. Atmospheric samples were gathered within evacuated flasks from 8-12 ground stations distributed over the northern (positive latitudes) and southern hemispheres, then sealed and transported to Boulder Colorado for analysis. Most emissions originate at northern latitudes, and are mixed through the troposphere of both hemispheres after about 1-2 years. Data sampling and analysis by: Halocarbons and Other Atmospheric Trace Species Group / Global Monitoring Division / Earth Systems Research Laboratories / United States National Oceanic and Atmospheric Administration https://www.esrl.noaa.gov/gmd/hats/
Title: HATS Nitrous Oxide concentration
Credit: https://www.esrl.noaa.gov/gmd/hats/combined/N2O.html
Author: NOAA
Usage Terms: Public domain
License: Public domain
Attribution Required?: No
Image usage
The following page links to this image:
