
Image: HATS Nitrous Oxide growth rate
No higher resolution available.
HATS_Nitrous_Oxide_growth_rate.png (695 × 385 pixels, file size: 19 KB, MIME type: image/png)
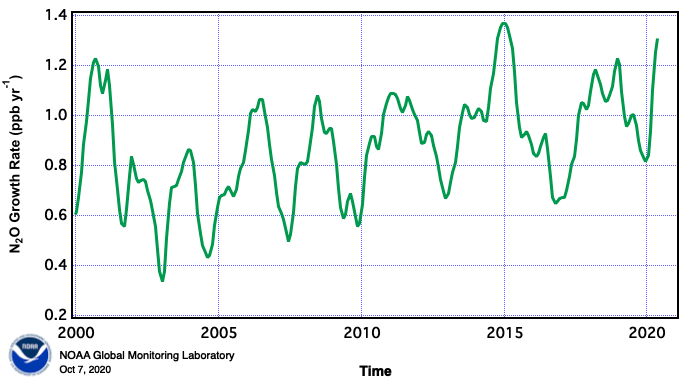
Description: This graph shows the annual growth rate in the concentration of nitrous oxide (N2O) in Earth's atmosphere versus time. X-axis data interval is approximately monthly. Y-axis growth rate units are parts per billion (ppb) per year. Data sampling and analysis by: Halocarbons and Other Atmospheric Trace Species Group / Global Monitoring Division / Earth Systems Research Laboratories / United States National Oceanic and Atmospheric Administration https://www.esrl.noaa.gov/gmd/hats/
Title: HATS Nitrous Oxide growth rate
Credit: https://www.esrl.noaa.gov/gmd/hats/combined/N2O.html
Author: NOAA
Usage Terms: Public domain
License: Public domain
Attribution Required?: No
Image usage
The following page links to this image:

All content from Kiddle encyclopedia articles (including the article images and facts) can be freely used under Attribution-ShareAlike license, unless stated otherwise.