
Image: HeatAus3

Size of this preview: 800 × 533 pixels. Other resolutions: 320 × 213 pixels | 4,500 × 3,000 pixels.
Original image (4,500 × 3,000 pixels, file size: 119 KB, MIME type: image/png)
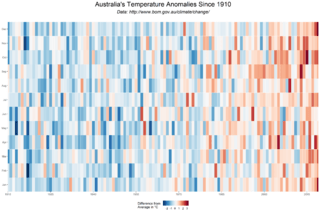
Description: Heatmap showing how hot or cold each month is in Australia compared to the 1960-1990 average for that month. data from Australian Government bureau of meteorology http://www.bom.gov.au/climate/change/#tabs=Tracker&tracker=timeseries&tQ=graph%3Dtmean%26area%3Daus%26season%3Dallmonths%26ave_yr%3D0 My ggplot2 rstats code to recreate this is at https://gist.github.com/cavedave/266485943bbd2b9cb8ee8654a9d2ffa3
Title: HeatAus3
Credit: Own work
Author: David Curran
Usage Terms: Creative Commons Attribution-Share Alike 4.0
License: CC BY-SA 4.0
License Link: https://creativecommons.org/licenses/by-sa/4.0
Attribution Required?: Yes
Image usage
The following page links to this image:

All content from Kiddle encyclopedia articles (including the article images and facts) can be freely used under Attribution-ShareAlike license, unless stated otherwise.