
Image: Hemispheric 14C graphs 1950s to 2010
No higher resolution available.
Hemispheric_14C_graphs_1950s_to_2010.png (598 × 505 pixels, file size: 11 KB, MIME type: image/png)
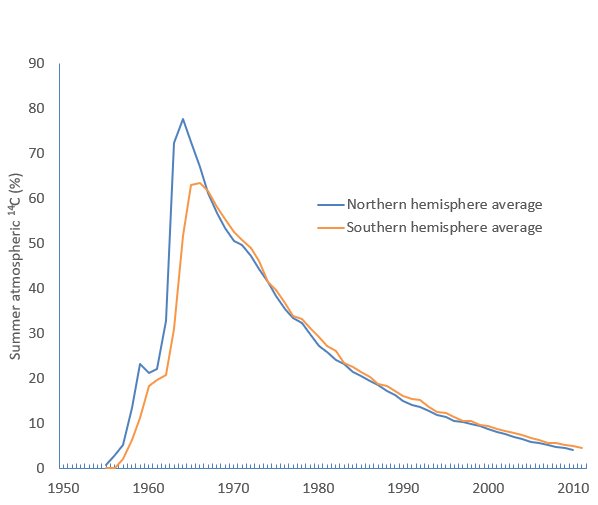
Description: Graph of the level of atmospheric carbon from the 1950s to c. 2010. Data from Hua et al. (2013) Radiocarbon 55(4): 2059-2072. The percentages are % excess over the pre-1950 value.
Title: Hemispheric 14C graphs 1950s to 2010
Credit: Own work
Author: Mike Christie
Usage Terms: Creative Commons Attribution-Share Alike 4.0
License: CC BY-SA 4.0
License Link: https://creativecommons.org/licenses/by-sa/4.0
Attribution Required?: Yes
Image usage
The following page links to this image:

All content from Kiddle encyclopedia articles (including the article images and facts) can be freely used under Attribution-ShareAlike license, unless stated otherwise.