
Image: IQ curve

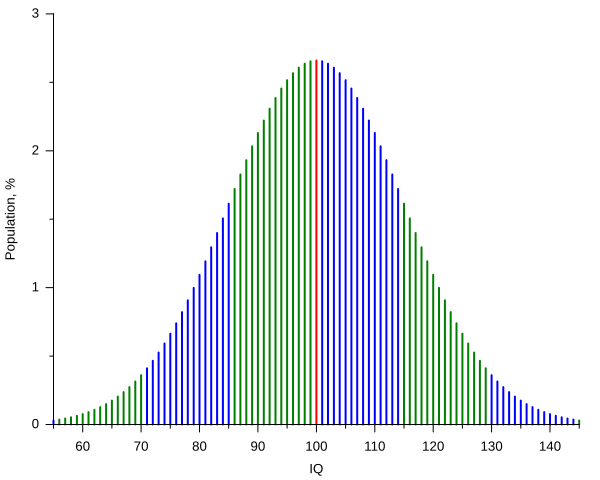
Description: Current IQ tests typically have standard scores such that the mean score is 100 with each standard deviation from the mean counting for 15 IQ points.[1] The plot shows, assuming that such scores have a normal distribution, the percentage of people getting a score versus the score itself, from 55 to 145 IQ, that is over a span of six standard deviations. Spans are represented with different colors for each standard deviation above or below the mean. The plot was created with the following gnuplot code: set terminal svg name 'IQ_curve' size 600,480 font ',10' rounded set output 'IQ_curve.svg' mu = 100.0 sigma = 15.0 from = 55 to = 145 # Normal distribution: # (continuos normalization approximation, good to ~10 digits in this case) P(x) = exp(-(x - mu)**2 / (2 * sigma**2)) / (sqrt(2 * pi) * sigma) * 100 # By sigma intervals: oddsi(x) = (int(abs(x - mu) / sigma) % 2) ^ (x < mu) Pm(x) = (x == mu) ? P(x) : 1/0 # sample at mu Po(x) = ( oddsi(x) && (x != mu)) ? P(x) : 1/0 # samples in odd sigma intervals Pe(x) = (!oddsi(x) && (x != mu)) ? P(x) : 1/0 # samples in even sigma intervals set key off set border 3 set xlabel 'IQ' set xtics 10 out nomirror set mxtics 2 set ylabel 'Population, %' set ytics 1 out nomirror set mytics 2 set samples (to - from + 1) set function style impulses plot [x = from:to] \ Pm(x) lw 2, \ Po(x) lw 2, \ Pe(x) lw 2 ↑ Kaufman, A.S. (2009) IQ Testing 101, New York (NY): Springer Publishing, pp. 104-109 ISBN: 978-0-8261-0629-2.
Title: IQ curve
Credit: Own work
Author: Alessio Damato, Mikhail Ryazanov
Usage Terms: Creative Commons Attribution-Share Alike 3.0
License: CC-BY-SA-3.0
License Link: http://creativecommons.org/licenses/by-sa/3.0/
Attribution Required?: Yes
Image usage
The following page links to this image:
