
Image: LIGO detector sensitivity curve
Size of this preview: 800 × 510 pixels. Other resolutions: 320 × 204 pixels | 1,000 × 637 pixels.
Original image (1,000 × 637 pixels, file size: 61 KB, MIME type: image/png)
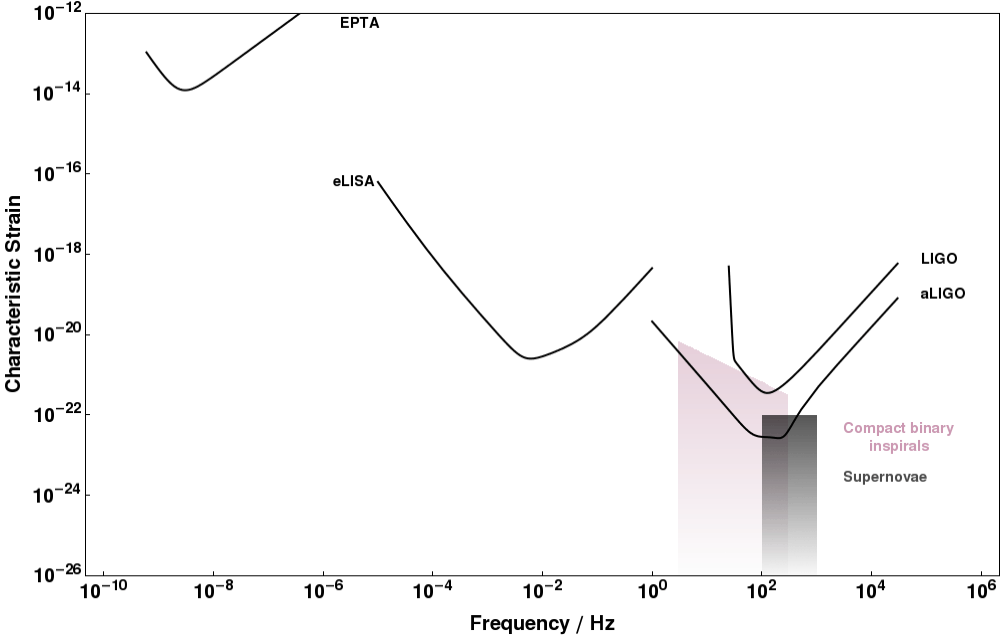
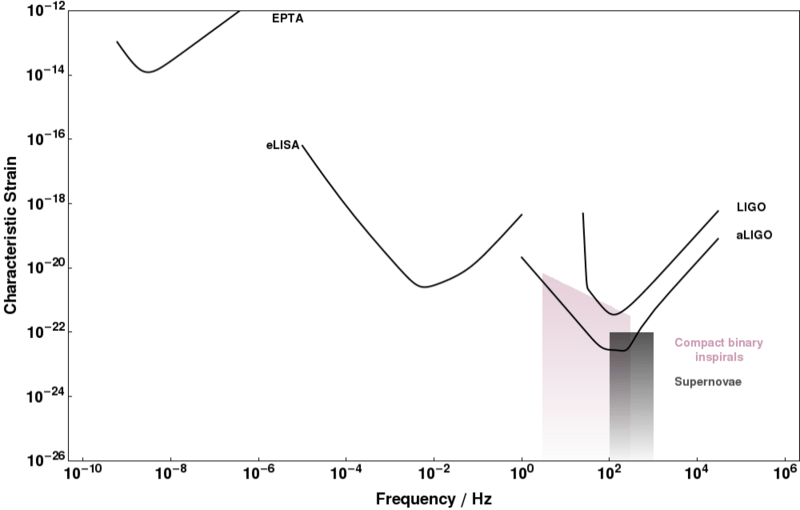
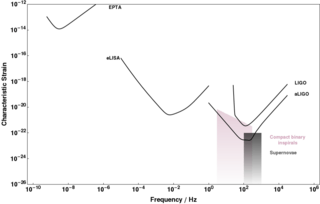
Description: Noise curves of the gravitational-wave detectors LIGO and Advanced LIGO as a function of frequency together with the characteristic strains of the potential gravitational-wave signals they are designed to measure.
Title: LIGO detector sensitivity curve
Credit: http://www.ast.cam.ac.uk/~rhc26/sources/
Author: Christopher Moore, Robert Cole and Christopher Berry
Permission: http://www.ast.cam.ac.uk/~rhc26/sources/
Usage Terms: Creative Commons Attribution-Share Alike 1.0
License: CC BY-SA 1.0
License Link: http://creativecommons.org/licenses/by-sa/1.0
Attribution Required?: Yes
Image usage
The following page links to this image:

All content from Kiddle encyclopedia articles (including the article images and facts) can be freely used under Attribution-ShareAlike license, unless stated otherwise.