
Image: LafferCurve

Size of this PNG preview of this SVG file: 512 × 345 pixels. Other resolution: 320 × 216 pixels.
Original image (SVG file, nominally 512 × 345 pixels, file size: 25 KB)
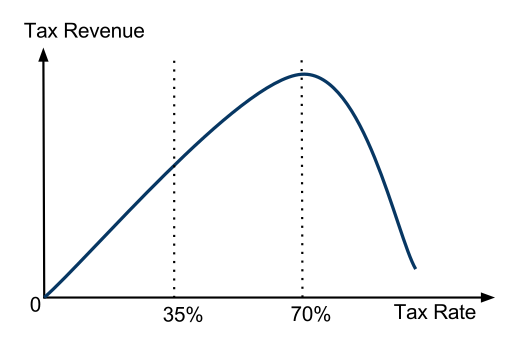
Description: A non-symmetric Laffer Curve with a maximum revenue point at around a 70% tax rate. This graph is based on the article "How Far Are We From The Slippery Slope? The Laffer Curve Revisited" by Mathias Trabandt and Harald Uhlig, NBER Working Paper No. 15343, September 2009. Specifically, it mimics the curve found in Figure 2 of that paper. Their research estimated Laffer Curve maximum revenue points to be between 60% to 80% tax rates.
Title: LafferCurve
Credit: Own work
Author: Lawrencekhoo
Usage Terms: Creative Commons Zero, Public Domain Dedication
License: CC0
License Link: http://creativecommons.org/publicdomain/zero/1.0/deed.en
Attribution Required?: No
Image usage
The following page links to this image:

All content from Kiddle encyclopedia articles (including the article images and facts) can be freely used under Attribution-ShareAlike license, unless stated otherwise.