
Image: M0-Money supply of the USA
Size of this preview: 800 × 308 pixels. Other resolutions: 320 × 123 pixels | 1,168 × 450 pixels.
Original image (1,168 × 450 pixels, file size: 98 KB, MIME type: image/jpeg)
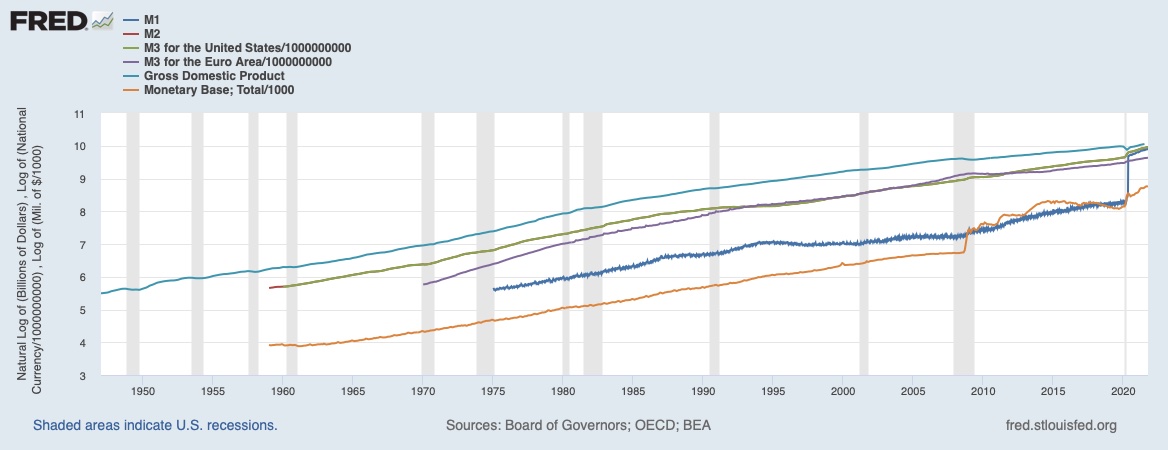
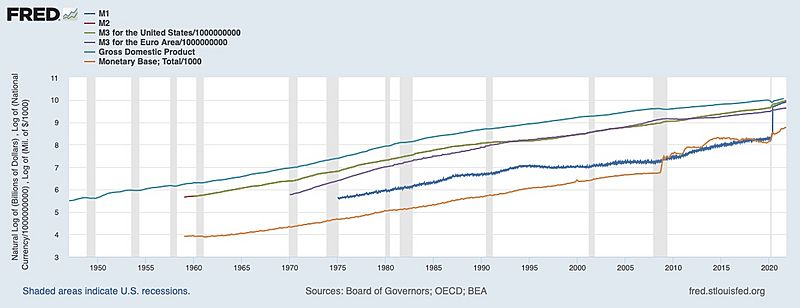
Description: Money supply USA, M0, M1, M3, US-GDP, M3 of the Eurozone. Graph made with Fredgraph of Federal Reserve St. Louis, logarithmic scale
Title: M0-Money supply of the USA
Credit: Own work, data from Fredgraph St. Louis and from European Central Bank. Own computations and presentation. For M1 with explanation for structural break May 2020 see: https://fred.stlouisfed.org/series/M1SL (https://fred.stlouisfed.org/graph/?graph_id=970712)
Author: Alex1011
Usage Terms: Creative Commons Attribution-Share Alike 4.0
License: CC BY-SA 4.0
License Link: https://creativecommons.org/licenses/by-sa/4.0
Attribution Required?: Yes
Image usage
The following page links to this image:

All content from Kiddle encyclopedia articles (including the article images and facts) can be freely used under Attribution-ShareAlike license, unless stated otherwise.