
Image: MeanMonthlyP
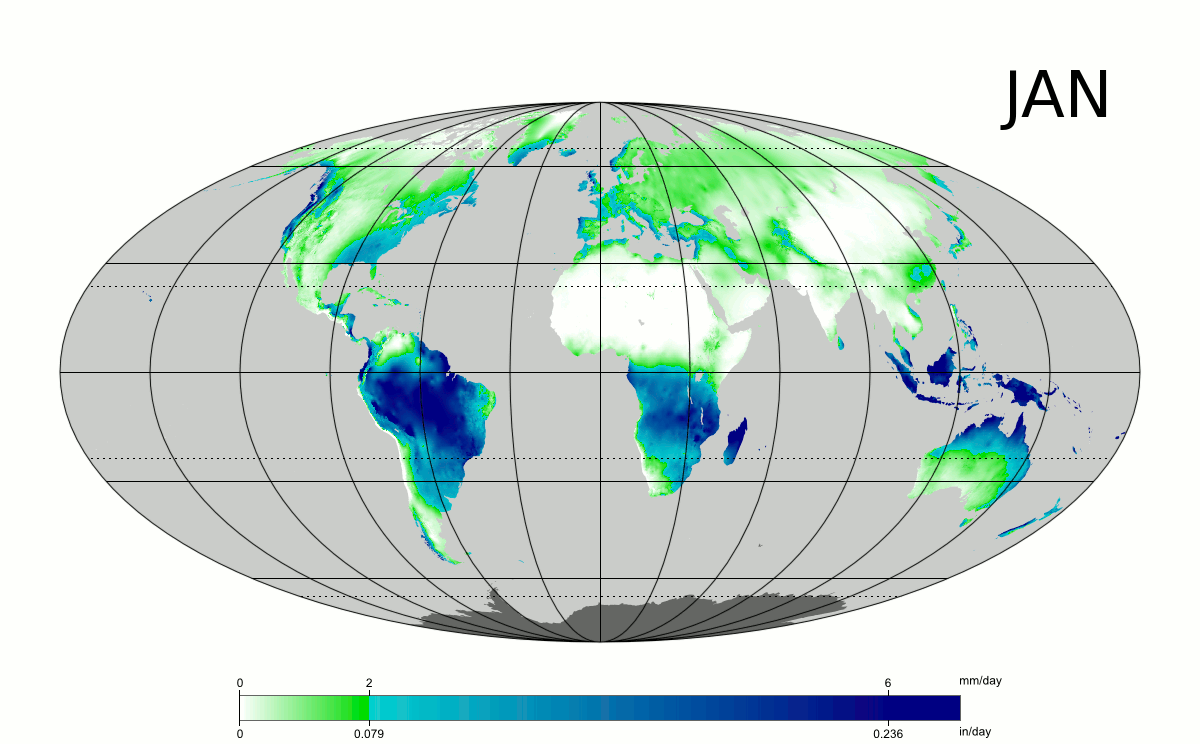
Size of this preview: 800 × 496 pixels. Other resolutions: 320 × 198 pixels | 1,200 × 744 pixels.
Original image (1,200 × 744 pixels, file size: 1.09 MB, MIME type: image/gif, looped, 12 frames, 12 s)
Description: Long-term average precipitation by month (mm/day and in/day), based on 1961-1990 data. Animated GIF. Mollweide projection.
Title: MeanMonthlyP
Credit: Own work by uploader, sources: CRU CL 2.0 (New, M., Lister, D., Hulme, M. and Makin, I., 2002: A high-resolution data set of surface climate over global land areas. Climate Research 21: 1–25) and File:Tissot indicatrix world map Mollweide proj.svg by Eric Gaba.
Author: PZmaps
Usage Terms: Creative Commons Attribution-Share Alike 3.0
License: CC BY-SA 3.0
License Link: http://creativecommons.org/licenses/by-sa/3.0
Attribution Required?: Yes
Image usage
The following 4 pages link to this image:

All content from Kiddle encyclopedia articles (including the article images and facts) can be freely used under Attribution-ShareAlike license, unless stated otherwise.