
Image: Moreno Sociogram 5th Grade

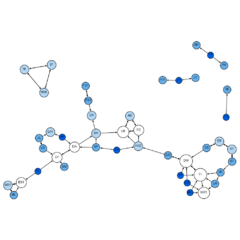
Description: Mapping the social affinities of a group of individuals, Moreno’s first sociograms visualize the relationships between pupils in a classroom: who wants to be sitting next to whom? Each child can choose two others, for results that suggest that sociabilities are changing over time: the proportion of attractions between boys and girls decrease, community structures are formed and then disappear, etc. Source: Grandjean, Martin (2015) Social network analysis and visualization: Moreno’s Sociograms revisited. Caption: Redesigned network strictly based on Moreno (1934), Who Shall Survive. Size and color of the nodes indicating the number of incoming connections ("in-degree" dark blue=0; white=3 and more).
Title: Moreno Sociogram 5th Grade
Credit: Own work
Author: Martin Grandjean
Usage Terms: Creative Commons Attribution-Share Alike 4.0
License: CC BY-SA 4.0
License Link: https://creativecommons.org/licenses/by-sa/4.0
Attribution Required?: Yes
Image usage
The following page links to this image:
