
Image: PapayaYield

Size of this preview: 800 × 488 pixels. Other resolutions: 320 × 195 pixels | 1,490 × 908 pixels.
Original image (1,490 × 908 pixels, file size: 471 KB, MIME type: image/png)
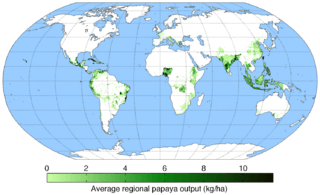
Description: Map of papaya production (average percentage of land used for its production times average yield in each grid cell) across the world compiled by the University of Minnesota Institute on the Environment with data from: Monfreda, C., N. Ramankutty, and J.A. Foley. 2008. Farming the planet: 2. Geographic distribution of crop areas, yields, physiological types, and net primary production in the year 2000. Global Biogeochemical Cycles 22: GB1022
Title: PapayaYield
Credit: Own work
Author: AndrewMT
Usage Terms: Creative Commons Attribution-Share Alike 3.0
License: CC BY-SA 3.0
License Link: https://creativecommons.org/licenses/by-sa/3.0
Attribution Required?: Yes
Image usage
The following page links to this image:

All content from Kiddle encyclopedia articles (including the article images and facts) can be freely used under Attribution-ShareAlike license, unless stated otherwise.