
Image: Rahul Dravid Test batting graph 10 innings average

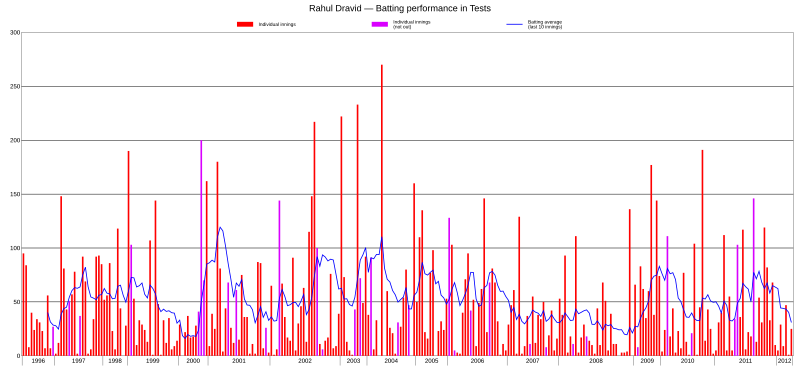
Description: This graph details the Test cricket performance of Rahul Dravid. The bars show the runs scored in each innings (purple bars indicate not out). The blue line shows the batting average of the 10 most recent innings at that point (cannot be calculated for first 9 innings). Source: this data from howstat.com.au. This graph has been created with this PHP script, with the following request URL (using localhost): http://127.0.0.1/battinggraph.php?id=2060&format=test&name=Rahul+Dravid&avg=10&max=300&scale=8&legend=1&legendmaxsize=3000&intervals=6&barwidth=12&barspacing=8&fontsize=45&barstyle=fill%3A%23ff0000%3B+fill-opacity%3A1%3B+stroke%3Anone¬outstyle=fill%3A%23ec36ff%3B+fill-opacity%3A1%3B+stroke%3Anone&avgstyle=fill%3Anone%3B+stroke%3A%230000ff%3B+stroke-width%3A6%3B+stroke-opacity%3A1&yearlabels=1 A graph with a career batting average is available at Rahul Dravid Test batting graph.svg.
Title: Rahul Dravid Test batting graph 10 innings average
Credit: Own work
Author: Jfd34
Usage Terms: Creative Commons Attribution 3.0
License: CC BY 3.0
License Link: https://creativecommons.org/licenses/by/3.0
Attribution Required?: Yes
Image usage
The following page links to this image:
