
Image: Real GDP Growth Rate by U.S. state

Size of this PNG preview of this SVG file: 800 × 396 pixels. Other resolution: 320 × 158 pixels.
Original image (SVG file, nominally 1,199 × 593 pixels, file size: 71 KB)
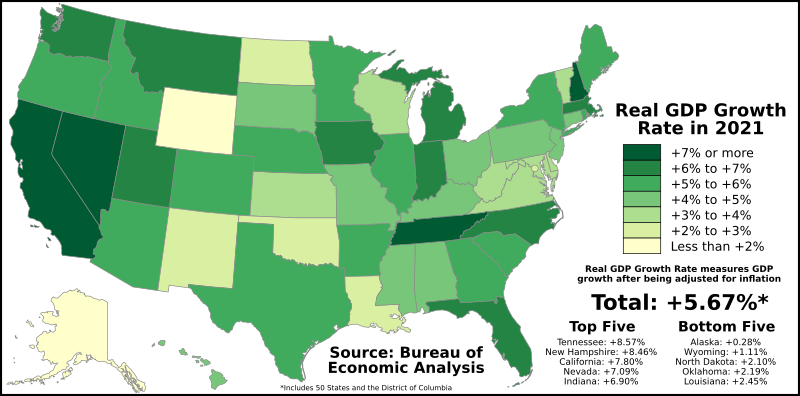
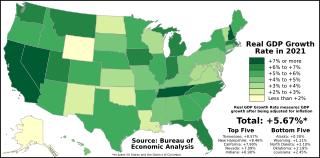
Description: The map above shows the Real GDP Growth Rate by U.S. state and the District of Columbia throughout the calendar year 2021. Data comes from the U.S. Bureau of Economic Analysis, from which data is easily accessible here. Legend +7% or more +6% to +7% +5% to +6% +4% to +5% +3% to +4% +2% to +3% +2% or less
Title: Real GDP Growth Rate by U.S. state
Credit: Own work
Author: Abbasi786786
Usage Terms: Creative Commons Attribution-Share Alike 4.0
License: CC BY-SA 4.0
License Link: https://creativecommons.org/licenses/by-sa/4.0
Attribution Required?: Yes
Image usage
The following page links to this image:

All content from Kiddle encyclopedia articles (including the article images and facts) can be freely used under Attribution-ShareAlike license, unless stated otherwise.