
Image: SlavePopulationUS1860

Size of this preview: 752 × 600 pixels. Other resolutions: 301 × 240 pixels | 10,503 × 8,380 pixels.
Original image (10,503 × 8,380 pixels, file size: 15.5 MB, MIME type: image/jpeg)
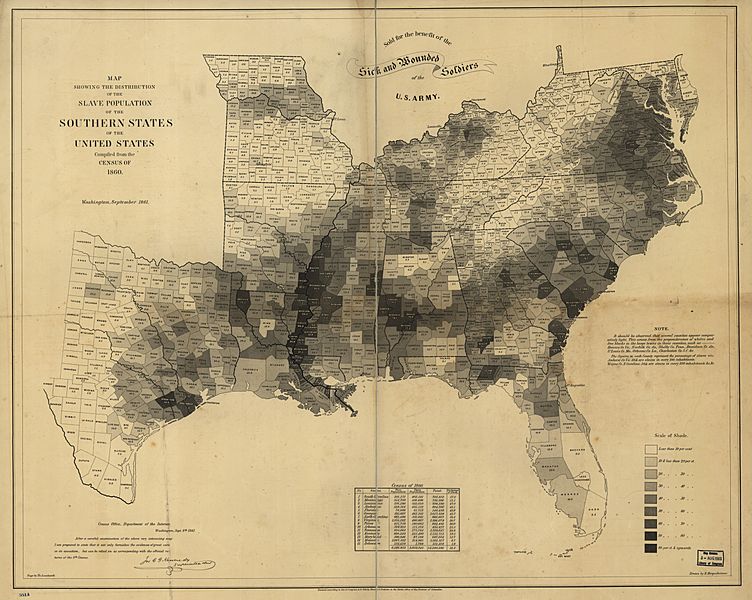
Description: Title: Map Showing the Distribution of the Slave Population of the Southern States of the United States Compiled from the Census of 1860. Sold for the benefit of the Sick and Wounded Soldiers of the U. S. Army. A map issued by the US Coast Guard showing the percentage of slaves in the population in each county in the slave-holding states of the United States in 1860, see http://opinionator.blogs.nytimes.com/2010/12/09/visualizing-slavery/
Title: SlavePopulationUS1860
Credit: United States Coast Survey’s map of the slaveholding states
Author: E. Hergesheimer (cartographer), Th. Leonhardt (engraver)
Usage Terms: Public domain
License: Public domain
Attribution Required?: No
Image usage
The following 3 pages link to this image:

All content from Kiddle encyclopedia articles (including the article images and facts) can be freely used under Attribution-ShareAlike license, unless stated otherwise.