
Image: Stellar evolution L vs T
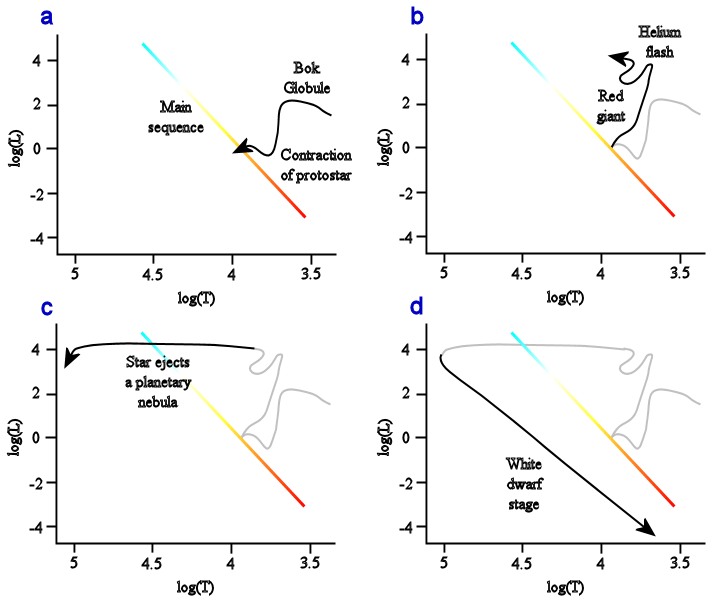
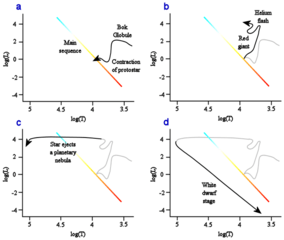
Description: This diagram shows the primary evolutionary stages of a solar-mass star. The axes are scaled to show the logarithm of the stellar Luminosity (L) versus the surface Temperature (T). In this diagram the Sun currently has a log(L) of zero and lies along the diagonal, main-sequence line. The star begins as a Bok globule (a) that contracts to form a condensing protostar. When it begins burning Hydrogen about 30 million years later, it stabilizes into a zero-age main sequence star. Thereafter it remains a main sequence star for about the next 10 billion years. The proportion of Helium at the core of this star steadily increases over this period, causing a gradual rise in luminosity. As the Hydrogen at the core becomes exhausted, the star blossoms into a massive red giant (b). The star increases in luminosity, burning Hydrogen in a shell around a degenerate Helium core. Finally the Helium flash triggers Helium fusion to begin at the core. One to two billion years after leaving the main sequence, the giant star now begins to experience a period of instability. The envelope is gently ejected (c), forming a planetary nebula and exposing the hot, compact core. Once Helium fusion has ceased, the star becomes a white dwarf (d) and slowly radiates away its remaining energy.
Title: Stellar evolution L vs T
Credit: After a diagram in Stars and Nebula by William J. Kaufmann, III.[1]
Author: Illustration by contributor.
Permission: Per license information.
Usage Terms: Creative Commons Attribution 2.5
License: CC BY 2.5
License Link: http://creativecommons.org/licenses/by/2.5
Attribution Required?: Yes
Image usage
The following page links to this image:
