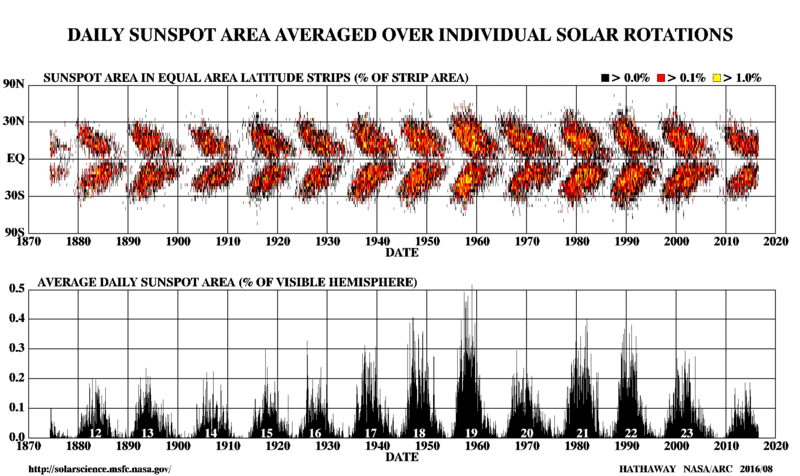
Image: Sunspot butterfly graph

Description: Butterfly diagram showing paired pattern of sunspots. Graph shows sunspot numbers. en:Spörer's law noted that at the start of an 11-year sunspot cycle, the spots appeared first at higher latitudes and later in progressively lower latitudes. The en:Babcock Model explains the behavior described by Spörer's law, as well as other effects, as being due to magnetic fields which are twisted by the Sun's rotation.
Title: Sunspot butterfly graph
Credit: http://solarscience.msfc.nasa.gov/images/bfly.gif (updated monthly) http://solarscience.msfc.nasa.gov/SunspotCycle.shtml (explanatory text)
Author: NASA, Marshal Space Flight Center, Solar Physics
Usage Terms: Public domain
License: Public domain
Attribution Required?: No
Image usage
The following page links to this image:

