
Image: USGS Kīlauea image-409
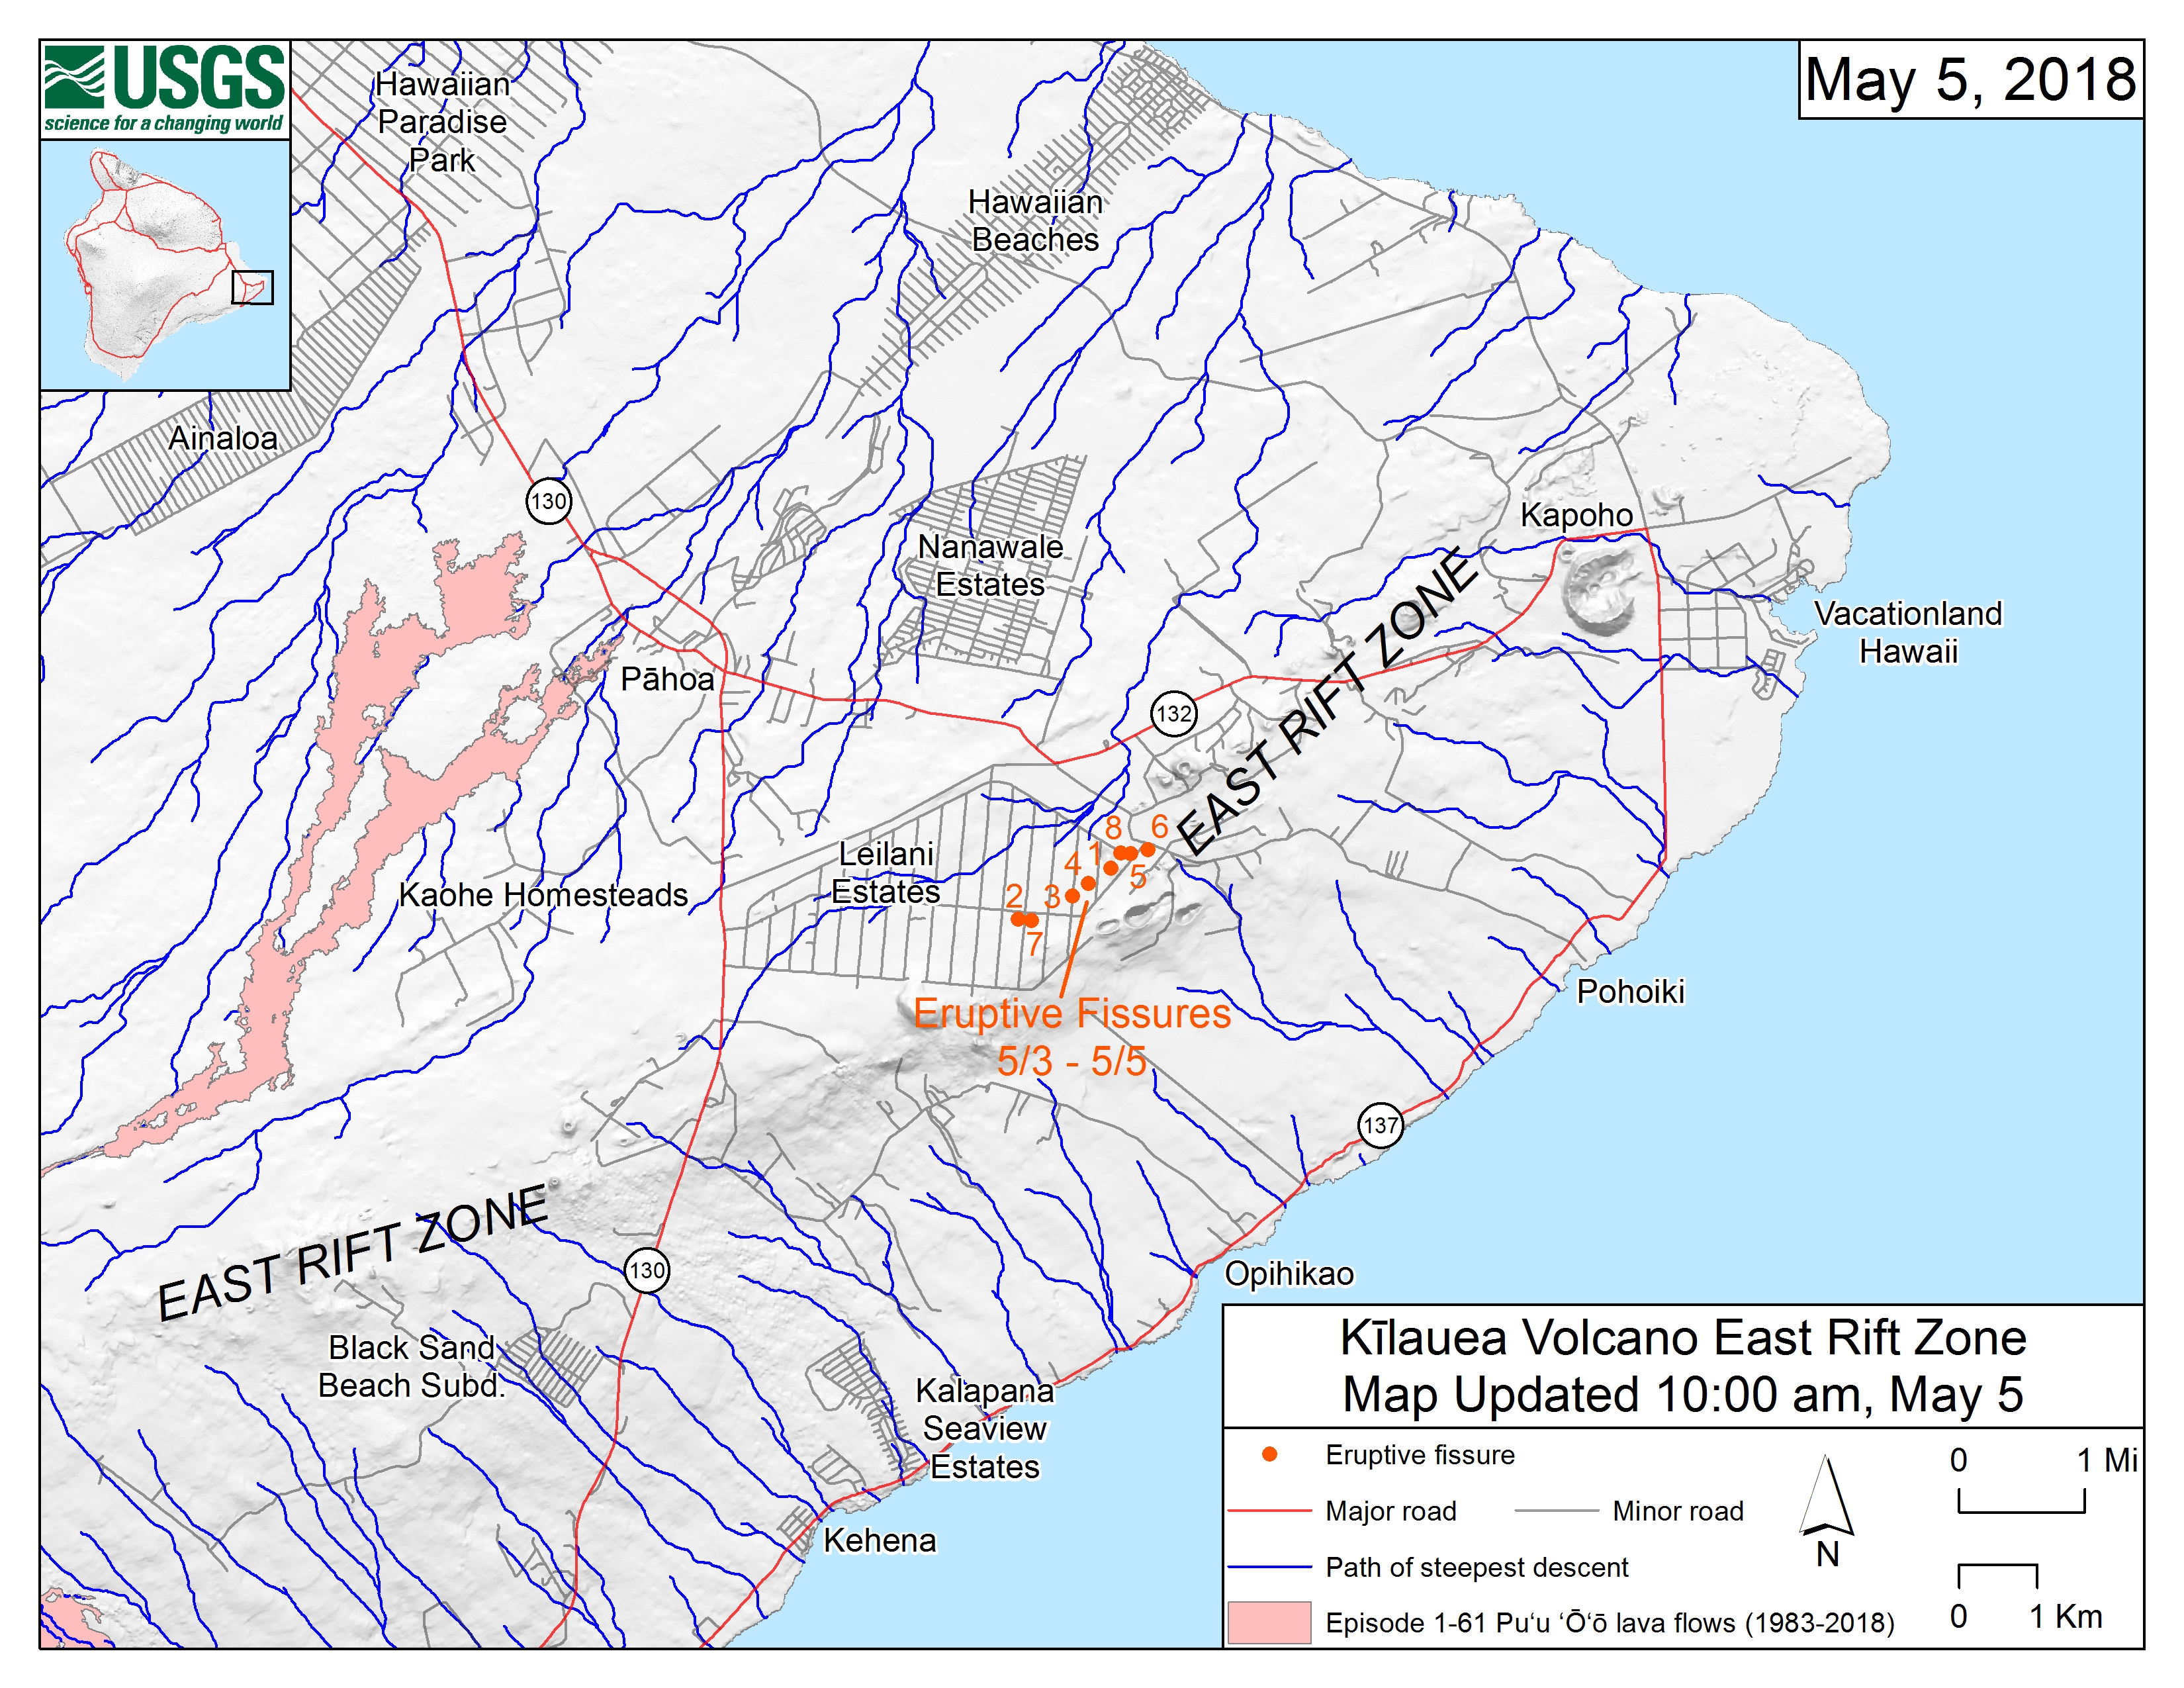
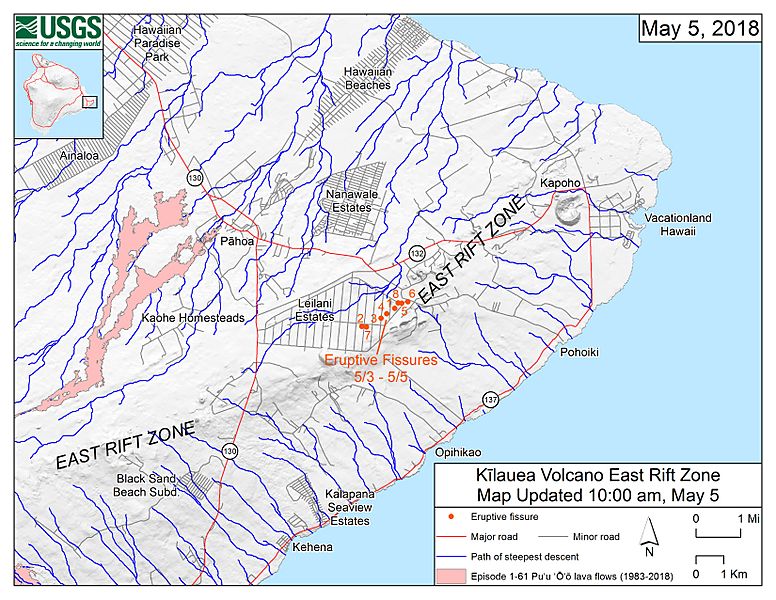
Description: Map of the locations of eruptive fissures and the steepest descent paths in area of eruptive fissures, Kīlauea East Rift Zone; 10:00 a.m. HST (May 5, 2018) This map shows the locations of eruptive fissures in the order that they occurred in the Leilani Estates Subdivision as of 10:00 a.m. HST (May 5, 2018). The blue lines are paths of steepest descent that identify likely paths of a lava flow, if and when lava moves downhill from an erupting vent. The paths of steepest-descent were calculated from a 1983 digital elevation model (DEM) of the Island of Hawai‘i, created from digitized contours. Steepest-descent path analysis is based on the assumption that the DEM perfectly represents the earth's surface. DEMs, however, are not perfect, so the blue lines on this map can be used to infer only approximate lava-flow paths. The base shaded-relief map was made from the 1983 10-m (DEM). For additional explanation of steepest descent paths, see http://pubs.usgs.gov/of/2007/1264. For calculation details, ESRI shapefiles, and KMZ versions of steepest descent paths, see https://www.sciencebase.gov/catalog/item/57fd072ee4b0824b2d130eb5.
Title: USGS Kīlauea image-409
Credit: https://volcanoes.usgs.gov/observatories/hvo/maps_uploads/image-409.jpg
Author: United States Geological Survey
Usage Terms: Public domain
License: Public domain
Attribution Required?: No
Image usage
The following 2 pages link to this image:
