
Image: US Employment Graph - 1920 to 1940

Size of this PNG preview of this SVG file: 755 × 600 pixels. Other resolution: 302 × 240 pixels.
Original image (SVG file, nominally 1,070 × 850 pixels, file size: 6 KB)
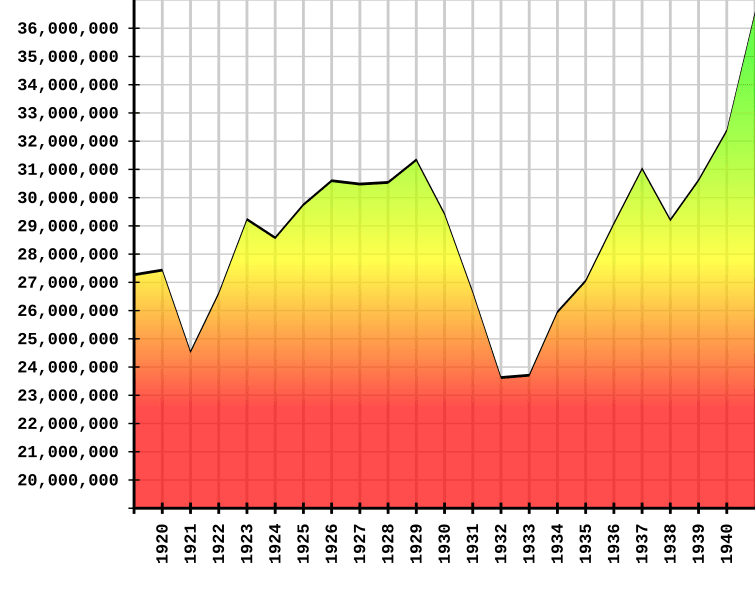
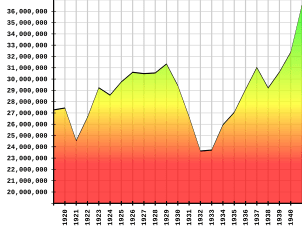
Description: A graph of employment rates in the United States between 1920 and 1940. Data was obtained from the U.S. Census Bureau Statistical Abstracts and converted into SVG format by me. The relevant information is in this PDF document, page 17, column 127. Note that these figures do not include farm or WPA employment.
Title: US Employment Graph - 1920 to 1940
Credit: Own work
Author: Crotalus horridus
Permission: Multi-licensed: GFDL and CC-BY-SA
Usage Terms: Creative Commons Attribution-Share Alike 4.0
License: CC BY-SA 4.0
License Link: https://creativecommons.org/licenses/by-sa/4.0
Attribution Required?: Yes
Image usage
The following page links to this image:

All content from Kiddle encyclopedia articles (including the article images and facts) can be freely used under Attribution-ShareAlike license, unless stated otherwise.