
Income distribution facts for kids

In economics, income distribution covers how a country's total GDP is distributed amongst its population. Economic theory and economic policy have long seen income and its distribution as a central concern. Unequal distribution of income causes economic inequality which is a concern in almost all countries around the world.
Contents
About
Classical economists such as Adam Smith (1723–1790), Thomas Malthus (1766–1834), and David Ricardo (1772–1823) concentrated their attention on factor income-distribution, that is, the distribution of income between the primary factors of production (land, labour and capital). Modern economists have also addressed issues of income distribution, but have focused more on the distribution of income across individuals and households. Important theoretical and policy concerns include the balance between income inequality and economic growth, and their often inverse relationship.
The Lorenz curve can represent the distribution of income within a society. The Lorenz curve is closely associated with measures of income inequality, such as the Gini coefficient.
Measurement

The concept of inequality is distinct from that of poverty and fairness. Income inequality metrics (or income distribution metrics) are used by social scientists to measure the distribution of income, and economic inequality among the participants in a particular economy, such as that of a specific country or of the world in general. While different theories may try to explain how income inequality comes about, income inequality metrics simply provide a system of measurement used to determine the dispersion of incomes.
Limitations
There exist some problems and limitations in the measurement of inequality as there is a large gap between the national accounts (which focus on macroeconomic totals) and inequality studies (which focus on distribution).
The lack of a comprehensive measure about how the pretax income differs from the post-tax income makes hard to assess how government redistribution effects inequality.
There is not a clear view on how long-run trends in income concentration are shaped by the major changes in woman's labour force participation.
Causes of income inequality
Causes of income inequality and of levels of equality/inequality include: labor economics, tax policies, other economic policies, labor union policies, Federal Reserve monetary policies & fiscal policies, the market for labor, abilities of individual workers, technology and automation, education, globalization, gender bias, racism, and culture.
How to improve income inequality
Taxes
The progressive income tax takes a larger percentage of high incomes and a smaller percentage of low incomes. Effectively, the poorest pay the least of their earned incomes on taxes which allows them to keep a larger percentage of wealth. Justification can be illustrated by a simple heuristic: The same dollar amount of money (e.g. $100) has a greater economic impact on only one party—the poor. That same amount has little economic impact on a wealthy individual, so the disparity is addressed by ensuring the richest individuals are taxed a greater share of their wealth. The state then uses the tax revenue to find necessary and beneficial activities for the society at large. Every person in this system would have access to the same social benefits, but the rich pay more for it, so progressive tax significantly reduces the inequality.
In-kind transfers
If a cash is given to a poor person, he or she may not make "the best" choice in case, what to buy for this extra money. Then, there is the solution in form of the food stamps or directly the food as an in-kind transfer to the poorest.
Housing subsidies
The rent and upkeep of housing form a large portion of spending in the lower income families. Housing subsidies were designed to help the poor obtaining adequate housing.
Welfare and Unemployment benefits
This provides actual money to the people with very low or no income and gives them an absolute freedom in decision-making how to use this benefit. This works best if we assume that they are rational and make decisions in their best interest.
Income mobility
Income mobility is another factor in the study of income inequality. It describes how people change their economic well-being, i.e. move in the hierarchy of earning power over their lifetime. When someone improves his economic situation, this person is considered upwardly mobile. Mobility can vary between two extremes: 1) rich people stay always rich and poor stay always poor: people can not that easily change their economic status and inequality then seems as a permanent problem. 2) individuals can easily shift their income class, e.g. from middle earning class to upper class or from lower class to middle class. Inequality is "fluid" and temporary so it does not create a serious permanent problem.
Measuring income mobility
Mobility is measured by the association between parents´ and adult children's socioeconomic standing, where higher association means less mobility. Socioeconomic standing is captured by four different measures:
- Occupational status: – it is weighted average of the mean level of earnings and education of certain occupations. It has advantages such a collecting important information about parents, which can be reported retrospectively by adult children. It also remains relatively stable in between the occupation career so single measuring provides adequate information of long run standing. On the other hand, it has also limitations for the mobility analyzing. Whereas occupational earning of men usually tends to be higher than by women, by the occupational education it is the other way around.
- Class mobility: – Classes are instead categorical groupings based on specific occupational assets that determine life chances as expressed in outcomes such as income, health or wealth.
- Earnings mobility: – Earning mobility evaluates the relationship between two certain generations by means of linear regression (upper math) of the long transformed measure of children's and parents' earnings.
- Total family income mobility and the mobility of women: – Old economic analysis has been making one mistake, that they did analysis that focused mostly on the father-son pairs and their individual earnings. In the last two decades, they have expanded their researches and now they focus more on the mother-daughter pairs as well. Generally earnings provides a stable measure of well-being independently of another financial assets or any kind of transfers.
Distribution measurement internationally
Using Gini coefficients, several organizations, such as the United Nations (UN) and the US Central Intelligence Agency (CIA), have measured income inequality by country. The Gini index is also widely used within the World Bank. It is an accurate and reliable index for measuring income distribution on a country by country level. The Gini index measurements go from 0 to 1 for 1 being perfect inequality and 0 being perfect equality. The world Gini index is measured at 0.52 as of 2016.

The World Inequality Lab at the Paris School of Economics published in December 2017 the World Inequality Report 2018 that provides estimates of global income and wealth inequality.
Trends

Standard economic theory stipulates that inequality tends to increase over time as a country develops, and to decrease as a certain average income is attained. This theory is commonly known as the Kuznets curve after Simon Kuznets. However, many prominent economists disagree with the need for inequality to increase as a country develops. Further, empirical data on the proclaimed subsequent decrease of inequality is conflicting.
There are two ways of looking at income inequality, within country inequality (intra-country inequality) – which is inequality within a nation; or between country inequality (inter-country inequality) which is inequality between countries.
According to intra-country inequality at least in the OECD countries, a May 2011 report by OECD stated that the gap between rich and poor within OECD countries (most of which are "high income" economies) "has reached its highest level for over 30 years, and governments must act quickly to tackle inequality".
Furthermore, increased inter-country income inequality over a long period is conclusive, with the Gini coefficient (using PPP exchange rate, unweighted by population) more than doubling between 1820 and the 1980s from .20 to .52 (Nolan 2009:63). However, scholars disagree about whether inter-country income inequality has increased (Milanovic 2011), remained relatively stable (Bourguignon and Morrisson 2002), or decreased (Sala-i-Martin, 2002) since 1980. What Milanovic (2005) calls the “mother of all inequality disputes” emphasizes this debate by using the same data on Gini coefficient from 1950 to 2000 and showing that when countries’ GDP per capita incomes are unweighted by population income inequality increases, but when they are weighted inequality decreases. This has much to do with the recent average income rise in China and to some extent India, who represent almost two-fifths of the world. Notwithstanding, inter-country inequality is significant, for instance as a group the bottom 5% of US income distribution receives more income than over 68 percent of the world, and of the 60 million people that make up the top 1% of income distribution, 50 million of them are citizens of Western Europe, North America or Oceania (Milanovic 2011:116,156).
In a TED presentation shown here , Hans Rosling presented the distribution and change in income distribution of various nations over the course of a few decades along with other factors such as child survival and fertility rate.
As of 2018, Albania has the smallest gap in wealth distribution with Zimbabwe having the largest gap in wealth distribution.
Income distribution in different countries
Thailand
- Thailand has been ranked the world's third most unequal nation after Russia and India, with a widening gap between rich and poor according to Oxfam in 2016. A study by Thammasat University economist Duangmanee Laovakul in 2013 showed that the country's top 20 land owners owned 80 percent of the nation's land. The bottom 20 owned only 0.3 percent. Among those having bank deposits, 0.1 percent of bank accounts held 49 per cent of total bank deposits. As of 2019[update], Thai per capita income is US$8,000 a year. The government aims to raise it to US$15,000 (498,771 baht) per year, driven by average GDP growth of five to six percent. Under the 20-year national plan stretching out to 2036, the government intends to narrow the income disparity gap to 15 times, down from 20 times in 2018.
United States
2011: In the United States, income has become distributed more unequally over the past 30 years, with those in the top quintile (20 percent) earning more than the bottom 80 percent combined.
2019: The wealthiest 10% of American households control nearly 75% of household net worth.
- Post-tax Gini coefficient: 0.39.
- Unemployment rate: 4.4%.
- GDP per capita: $53 632.
- Poverty rate: 11.1%.
Low unemployment rate and high GDP are signs of the health of the U.S. economy. But there is almost 18% of people living below the poverty line and the Gini coefficient is quite high. That ranks the United States 9th income inequal in the world.
United Kingdom
Inequality in the UK has been very high in the past, and did not change much until the onset of industrialization. Incomes used to be remarkably concentrated pre-industrial evolution: up to 40% of total income went into the pockets of the richest 5%. In the more recent years income distribution is still an issue. The UK experienced a large increase in inequality during the 1980s—the incomes of the highest deciles increase while everyone else was stagnant. Uneven growth in the years leading up to 1991 meant further increases in inequality. Throughout the 1990s and 2000s, more even growth across the distribution meant little changes in inequality, with rising incomes for everybody. In sight of Brexit, there is more predicted income distribution discrepancies between wages.
2019: The United Kingdom was doing a lot to reduce one of the widest gap between rich and poor citizens, what has led to getting on the 13th place in the ranking of income inequality in the world.
- Post-tax Gini coefficient: 0.35.
- Unemployment rate: 4.3%.
- GDP per capita: $39 425.
- Poverty rate: 11.1%.
Russia
- Post-tax Gini coefficient: 0.38.
- Unemployment rate: 5.2%.
- GDP per capita: $24 417.
- Poverty rate: NA.
Occupying the 11th place in the ranking of income inequality in the world. USA TODAY stated: "Russia has a Corruption Perceptions Index score of 28 – tied for the worst among OECD member states and affiliates and one of the lowest in the world. " The cause of the income gap are the close connections of Russian oligarchs and the government, thanks to these relationships oligarchs get lucrative business deals and earn more and more money.
South Africa
- Post-tax Gini coefficient: 0.62.
- Unemployment rate: 27.3%.
- GDP per capita: $12 287.
- Poverty rate: 26.6%.
The highest income inequality is in the South Africa, based on 2019 data. It is due to the recent policy of apartheid. There were huge differences between white and the other people, not only in wages, but also in the place they can enter and so on.
Development of income distribution as a stochastic process
It is difficult to create a realistic and not complicated theoretical model, because the forces determining the distribution of income (DoI) are varied and complex and they continuously interact and fluctuate.
In a model by Champernowne, the author assumes that the income scale is divided into an enumerable infinity of income ranges, which have uniform proportionate distribution. The development through time of the DoI between ranges is regarded to be a stochastic process. The income of any person in one year may depend on the income in the previous year and on a chance of progress. Assuming that to every "dying" income receiver, there is an heir to his or her income in the following year, and vice versa. This implies that the number of incomes is constant through time.
Under these assumptions any historical development of the DoI can be described by the following vectors and matrices.
 ... number of the income receivers in range r = 1, 2, ... in the initial year
 ... matrix, that contains proportions of the occupants of r-th range in the year
  shifted to the s-th range in the following year
The vector of the DoI can be expressed as
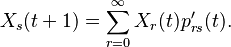
The elements of proportion matrices can be estimated from historical data.
See also
 In Spanish: Distribución de la renta para niños
- Subsidy
- Wage/price spiral
- Poverty
- Gini coefficient
- Affluence in the United States
- Kinetic exchange models of markets
- Median household income
- Personal income in the United States
- Poverty in the United States
- Redistribution of wealth
- Wealth distribution
