
Limit (mathematics) facts for kids
In mathematics, a limit is an anticipated value of a function or sequence based on the points around it. As a function performs operations on different inputs, this can cause strange results with certain numbers, especially if we try to plot them on a Cartesian graph; limits are a way of explaining what happens in these cases.
Format
Limits are used to define many topics in calculus, like continuity, derivatives, and integrals.
For a function f, limit are written like this:
which reads "the limit of f of x, as x approaches c equals L". An alternative notation is " as
as  ", which reads "
 tends to
  as
as  tends to
  ". Limit is shortened to lim.
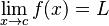
For a sequence  , the similar notation
  is used.
Example

 . Note that the line doesn't touch 0 on either axis as
  is undefined.
Imagine we have a function that takes an input, , and then outputs  to
to  . If we were to draw a graph using x and y as coordinates, the results would look like this:
| x input | function | y output | x, y |
|---|---|---|---|
| 4 |  |
0.25 | 4, 0.25 |
| 3 |  |
0.33 | 3, 0.33 |
| 2 |  |
0.5 | 2, 0.5 |
| 1 |  |
1 | 1, 1 |
| 0 |  |
undefined | 0, undefined |
As we can see here, division by zero is undefined. But if we look closer, then we can see that we still have valid output—as long as we never reach zero:
| x input | function | y output | x, y |
|---|---|---|---|
| 1 | |
1 | 1, 1 |
| 0.5 |  |
2 | 0.5, 2 |
| 0.25 |  |
4 | 0.25, 4 |
| 0.125 | 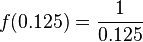 |
8 | 0.125, 8 |
| -0.125 | 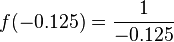 |
-8 | -0.125, -8 |
| -0.25 | 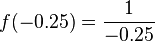 |
-4 | -0.25, -4 |
| -0.5 | 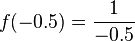 |
-2 | -0.5, -2 |
| -1 |  |
-1 | -1, -1 |
This problem is unique to zero as the function still works on every value up to zero, even if we approach from the negative side. As input numbers get arbitrarily small, the output will simply get arbitrarily large, and if we draw this on a graph, the line will stretch upwards without bound before it touches 0 on either axis.
One way we describe this is "The limit of  as approaches 0, from the right side, is
  ", meaning that can keep increasing beyond bounds, as long as x doesn't reach 0. Mathematically, this is written as:
 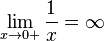 .
.
Applications
While a limit cannot be reached, it can be approached to get a more accurate output value. For example, the mathematical constant  (Euler's number) can be found by calculating
  , where
  is an input:
| n input | function | output (e) |
|---|---|---|
| 1 |  |
2 |
| 10 |  |
2.5937424601 |
| 10,000 |  |
2.7182682372 |
| 10,000,000 |  |
2.71828169398... |
While the equation will never be equal to , putting in a larger input will get us closer to it, and make our output more accurate. Mathematically, we can express this by saying that "The limit of  as approaches is ", which is noted as
  .
.
Related pages
- Limit of a sequence
- Cauchy sequence
- Limit of a function
- Big O notation: used to describe the limiting behavior of a function when the argument tends towards a particular value or infinity
Images for kids
-
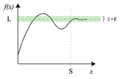
For all x > S, the value f(x) is within a distance ε of L.

See also
 In Spanish: Límite (matemática) para niños
