
List of municipalities in Nova Scotia facts for kids


Nova Scotia is the seventh-most populous province in Canada with 923,598 residents as of the 2016 Census of Population, and the second-smallest province in land area at 52,942 km2 (20,441 sq mi). Nova Scotia's 50 municipalities cover 99.8% of the territory's land mass, and are home to 98.9% of its population.
List of municipalities
-
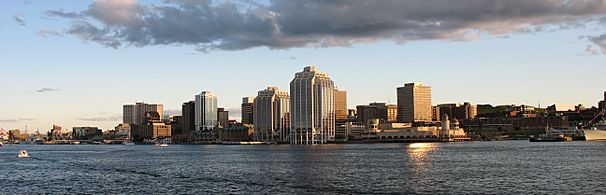
Halifax is Nova Scotia's capital and largest municipality by population.
-
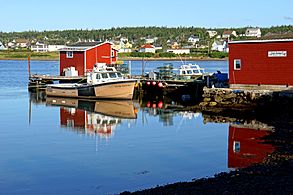
Harbour of Louisbourg in Cape Breton, Nova Scotia's second-most populated municipality
-
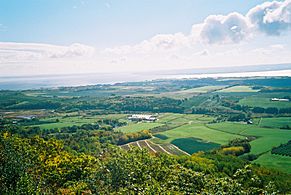
The Municipality of the County of Kings is Nova Scotia's largest county municipality by population.


| Name | Municipal type | Incorporation date |
2016 Census of Population | ||||
|---|---|---|---|---|---|---|---|
| Population (2016) |
Population (2011) |
Change |
Land area (km²) |
Population density |
|||
| Cape Breton | Regional municipality | August 1, 1995 | 94,285 | 97,398 | −3.2% | 2,430.06 | 38.8/km2 |
| Halifax | Regional municipality | April 1, 1996 | 403,131 | 390,086 | +3.3% | 5,490.35 | 73.4/km2 |
| Queens | Regional municipality | April 1, 1996 | 10,307 | 10,917 | −5.6% | 2,392.63 | 4.3/km2 |
| Annapolis | County municipality | April 17, 1879 | 18,252 | 18,526 | −1.5% | 3,178.21 | 5.7/km2 |
| Antigonish | County municipality | April 17, 1879 | 14,584 | 14,692 | −0.7% | 1,450.27 | 10.1/km2 |
| Colchester | County municipality | April 17, 1879 | 36,091 | 36,624 | −1.5% | 3,572.49 | 10.1/km2 |
| Cumberland | County municipality | April 17, 1879 | 19,402 | 20,485 | −5.3% | 4,255.04 | 4.6/km2 |
| Inverness | County municipality | April 17, 1879 | 13,190 | 13,781 | −4.3% | 3,815.59 | 3.5/km2 |
| Kings | County municipality | April 17, 1879 | 47,404 | 47,569 | −0.3% | 2,094.05 | 22.6/km2 |
| Pictou | County municipality | April 17, 1879 | 20,692 | 21,278 | −2.8% | 2,797.25 | 7.4/km2 |
| Richmond | County municipality | April 17, 1879 | 8,458 | 8,812 | −4.0% | 1,243.72 | 6.8/km2 |
| Victoria | County municipality | April 17, 1879 | 6,552 | 6,597 | −0.7% | 2,854.01 | 2.3/km2 |
| Argyle | District municipality | April 17, 1879 | 7,899 | 8,252 | −4.3% | 1,528.17 | 5.2/km2 |
| Barrington | District municipality | April 17, 1879 | 6,646 | 6,994 | −5.0% | 632.35 | 10.5/km2 |
| Chester | District municipality | April 17, 1879 | 10,310 | 10,599 | −2.7% | 1,122.11 | 9.2/km2 |
| Clare | District municipality | April 17, 1879 | 8,018 | 8,319 | −3.6% | 852.55 | 9.4/km2 |
| Digby | District municipality | April 17, 1879 | 7,107 | 7,463 | −4.8% | 1,657.33 | 4.3/km2 |
| East Hants | District municipality | April 17, 1879 | 22,453 | 22,111 | +1.5% | 1,786.56 | 12.6/km2 |
| Guysborough | District municipality | April 17, 1879 | 4,670 | 4,995 | −6.5% | 2,116.86 | 2.2/km2 |
| Lunenburg | District municipality | April 17, 1879 | 24,863 | 25,118 | −1.0% | 1,759.59 | 14.1/km2 |
| Shelburne | District municipality | April 17, 1879 | 4,288 | 4,408 | −2.7% | 1,821.07 | 2.4/km2 |
| St. Mary's | District municipality | April 17, 1879 | 2,233 | 2,354 | −5.1% | 1,909.47 | 1.2/km2 |
| West Hants | District municipality | April 17, 1879 | 15,368 | 15,324 | +0.3% | 1,244.09 | 12.4/km2 |
| Yarmouth | District municipality | April 17, 1879 | 9,845 | 10,105 | −2.6% | 586.65 | 16.8/km2 |
| Amherst | Town | December 18, 1889 | 9,413 | 9,717 | −3.1% | 12.07 | 779.9/km2 |
| Annapolis Royal | Town | November 29, 1892 | 491 | 481 | +2.1% | 2.04 | 240.7/km2 |
| Antigonish | Town | January 9, 1889 | 4,364 | 4,524 | −3.5% | 5.01 | 871.1/km2 |
| Berwick | Town | May 25, 1923 | 2,509 | 2,454 | +2.2% | 6.58 | 381.3/km2 |
| Bridgewater | Town | February 13, 1899 | 8,532 | 8,241 | +3.5% | 13.63 | 626.0/km2 |
| Clark's Harbour | Town | March 4, 1919 | 758 | 820 | −7.6% | 2.81 | 269.8/km2 |
| Digby | Town | December 18, 1890 | 2,060 | 2,152 | −4.3% | 3.15 | 654.0/km2 |
| Kentville | Town | May 1, 1886 | 6,271 | 6,094 | +2.9% | 17.26 | 363.3/km2 |
| Lockeport | Town | February 26, 1907 | 531 | 588 | −9.7% | 2.33 | 227.9/km2 |
| Lunenburg | Town | October 29, 1888 | 2,263 | 2,313 | −2.2% | 4.04 | 560.1/km2 |
| Mahone Bay | Town | March 31, 1919 | 1,036 | 943 | +9.9% | 3.12 | 332.1/km2 |
| Middleton | Town | May 31, 1909 | 1,832 | 1,749 | +4.7% | 5.57 | 328.9/km2 |
| Mulgrave | Town | December 1, 1923 | 722 | 794 | −9.1% | 17.83 | 40.5/km2 |
| New Glasgow | Town | May 6, 1875 | 9,075 | 9,562 | −5.1% | 9.96 | 911.1/km2 |
| Oxford | Town | April 19, 1904 | 1,190 | 1,151 | +3.4% | 10.76 | 110.6/km2 |
| Pictou | Town | May 4, 1874 | 3,186 | 3,437 | −7.3% | 8.01 | 397.8/km2 |
| Port Hawkesbury | Town | January 22, 1889 | 3,214 | 3,366 | −4.5% | 8.1 | 396.8/km2 |
| Shelburne | Town | April 4, 1907 | 1,743 | 1,686 | +3.4% | 8.84 | 197.2/km2 |
| Stellarton | Town | October 22, 1889 | 4,208 | 4,485 | −6.2% | 8.99 | 468.1/km2 |
| Stewiacke | Town | August 30, 1906 | 1,373 | 1,438 | −4.5% | 17.62 | 77.9/km2 |
| Trenton | Town | March 18, 1911 | 2,474 | 2,616 | −5.4% | 6.07 | 407.6/km2 |
| Truro | Town | May 6, 1875 | 12,261 | 12,059 | +1.7% | 34.49 | 355.5/km2 |
| Westville | Town | August 20, 1894 | 3,628 | 3,798 | −4.5% | 14.23 | 255.0/km2 |
| Windsor | Town | April 4, 1878 | 3,648 | 3,785 | −3.6% | 9.11 | 400.4/km2 |
| Wolfville | Town | March 4, 1893 | 4,195 | 4,269 | −1.7% | 6.46 | 649.4/km2 |
| Yarmouth | Town | August 6, 1890 | 6,518 | 6,761 | −3.6% | 10.57 | 616.7/km2 |
| Total regional municipalities | — | — | 507,723 | 498,401 | +1.9% | 10,313.04 | 49.2/km2 |
| Total county municipalities | — | — | 184,625 | 188,364 | −2.0% | 25,260.63 | 7.3/km2 |
| Total district municipalities | — | — | 123,700 | 126,042 | −1.9% | 17,016.8 | 7.3/km2 |
| Total towns | — | — | 97,495 | 99,283 | −1.8% | 248.65 | 392.1/km2 |
| Total municipalities | — | — | 913,543 | 912,090 | +0.2% | 52,839.12 | 17.3/km2 |
| Province of Nova Scotia | — | — | 923,598 | 921,727 | +0.2% | 52,942.27 | 17.45/km2 |
Notes
Images for kids
-
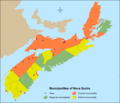
Distribution of Nova Scotia's 49 municipalities by municipal status type
-
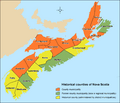
Distribution of Nova Scotia's 18 historical counties by municipal status
-
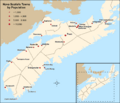
Distribution of Nova Scotia's 25 towns by population


