
Montfort, Wisconsin facts for kids
Quick facts for kids
Montfort, Wisconsin
|
|
|---|---|
|
Village
|
|

Looking west at Montfort
|
|

Location of Montfort in Grant County, Wisconsin.
|
|
| Country | |
| State | |
| Counties | Grant, Iowa |
| Incorporated | 1893 |
| Area | |
| • Total | 0.54 sq mi (1.39 km2) |
| • Land | 0.54 sq mi (1.39 km2) |
| • Water | 0.00 sq mi (0.00 km2) |
| Elevation | 1,109 ft (338 m) |
| Population
(2010)
|
|
| • Total | 718 |
| • Estimate
(2019)
|
688 |
| • Density | 1,278.81/sq mi (493.77/km2) |
| Time zone | UTC-6 (Central (CST)) |
| • Summer (DST) | UTC-5 (CDT) |
| Area code(s) | 608 |
| FIPS code | 55-53950 |
| GNIS feature ID | 1569677 |
Montfort is a village in Grant and Iowa Counties in the U.S. state of Wisconsin. The population was 718 at the 2010 census. Of this, 622 were in Grant County, and 96 were in Iowa County.
The Iowa County portion of Montfort is part of the Madison Metropolitan Statistical Area, while the Grant County portion is part of the Platteville Micropolitan Statistical Area.
History
Montfort was named from an old fort situated on a nearby hill.
Geography
Montfort is located at 42°58′17″N 90°25′59″W / 42.97139°N 90.43306°W (42.971399, -90.432937).
According to the United States Census Bureau, the village has a total area of 0.54 square miles (1.40 km2), all of it land.
Demographics
| Historical population | |||
|---|---|---|---|
| Census | Pop. | %± | |
| 1880 | 64 | — | |
| 1890 | 407 | 535.9% | |
| 1900 | 627 | 54.1% | |
| 1910 | 558 | −11.0% | |
| 1920 | 598 | 7.2% | |
| 1930 | 554 | −7.4% | |
| 1940 | 615 | 11.0% | |
| 1950 | 576 | −6.3% | |
| 1960 | 538 | −6.6% | |
| 1970 | 518 | −3.7% | |
| 1980 | 616 | 18.9% | |
| 1990 | 676 | 9.7% | |
| 2000 | 663 | −1.9% | |
| 2010 | 718 | 8.3% | |
| 2019 (est.) | 688 | −4.2% | |
| U.S. Decennial Census | |||
2010 census
As of the census of 2010, there were 718 people, 279 households, and 192 families living in the village. The population density was 1,329.6 inhabitants per square mile (513.4/km2). There were 298 housing units at an average density of 551.9 per square mile (213.1/km2). The racial makeup of the village was 98.6% White, 0.8% African American, and 0.6% from other races. Hispanic or Latino of any race were 1.3% of the population.
There were 279 households, of which 34.1% had children under the age of 18 living with them, 53.8% were married couples living together, 10.0% had a female householder with no husband present, 5.0% had a male householder with no wife present, and 31.2% were non-families. 22.2% of all households were made up of individuals, and 10% had someone living alone who was 65 years of age or older. The average household size was 2.56 and the average family size was 2.98.
The median age in the village was 35.9 years. 24.8% of residents were under the age of 18; 10.5% were between the ages of 18 and 24; 24.5% were from 25 to 44; 28.3% were from 45 to 64; and 11.8% were 65 years of age or older. The gender makeup of the village was 50.6% male and 49.4% female.
Images for kids
-
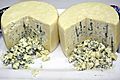
Award-winning Montforte blue cheese made in Montfort, USDA 2013

See also
 In Spanish: Montfort (Wisconsin) para niños
