Orcutt, California facts for kids
Quick facts for kids
Orcutt
|
|
|---|---|

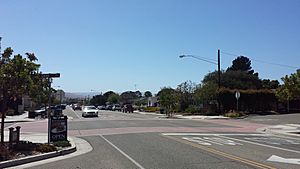
Clark Avenue in downtown Old Orcutt, looking west, between Highways 1 and 135
|
|

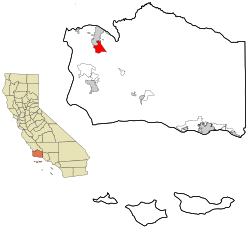
Location in Santa Barbara County and the state of California
|
|
| Country | |
| State | |
| County | Santa Barbara |
| Area | |
| • Total | 11.129 sq mi (28.825 km2) |
| • Land | 11.124 sq mi (28.811 km2) |
| • Water | 0.005 sq mi (0.014 km2) 0.05% |
| Elevation | 358 ft (109 m) |
| Population
(2019)
|
|
| • Total | 31,118 |
| • Density | 2,796.12/sq mi (1,079.55/km2) |
| Time zone | UTC-8 (PST) |
| • Summer (DST) | UTC-7 (PDT) |
| ZIP codes |
93455, 93457
|
| Area code | 805 |
| FIPS code | 06-54120 |
| GNIS feature IDs | 1661153, 2408999 |
Orcutt is an unincorporated town located in the Santa Maria Valley in Santa Barbara County, California, United States. Orcutt is named for William Warren Orcutt, the manager of the Geological, Land and Engineering Departments of the Union Oil Company.
The population of Orcutt was 28,905 at the 2010 census, up from 28,830 at the 2000 census.
Geography
Orcutt is located at 34°52′28″N 120°25′41″W / 34.87444°N 120.42806°W (34.874550, -120.428067).
According to the United States Census Bureau, the CDP has a total area of 11.1 square miles (29 km2), 99.95% of it land and 0.05% of it water.
Orcutt, originally sited along a railroad siding of the Pacific Coast Railroad as a townsite for oil field workers, is now primarily a bedroom community/suburb of Santa Maria, which is adjacent to the north. Located between California State Route 135 on the east and south, the Cabrillo Highway (Route 1) on the west, the community's northern boundary is south side of the Foxenwood section of Santa Maria. In 2005 it was one of the fastest-growing places in Santa Barbara County.
Climate
This region experiences warm (but not hot) and dry summers, with no average monthly temperatures above 71.6 °F. According to the Köppen Climate Classification system, Orcutt has a warm-summer Mediterranean climate, abbreviated "Csb" on climate maps.
| Climate data for Orcutt, California | |||||||||||||
|---|---|---|---|---|---|---|---|---|---|---|---|---|---|
| Month | Jan | Feb | Mar | Apr | May | Jun | Jul | Aug | Sep | Oct | Nov | Dec | Year |
| Average high °C (°F) | 17 (62) |
17 (62) |
18 (64) |
19 (66) |
19 (66) |
21 (69) |
22 (71) |
23 (73) |
23 (73) |
23 (73) |
20 (68) |
18 (64) |
20 (68) |
| Average low °C (°F) | 3 (37) |
4 (39) |
5 (41) |
6 (42) |
8 (46) |
10 (50) |
11 (51) |
12 (53) |
11 (51) |
8 (46) |
5 (41) |
3 (37) |
7 (44) |
| Average precipitation mm (inches) | 61 (2.4) |
76 (3) |
61 (2.4) |
28 (1.1) |
7.6 (0.3) |
2.5 (0.1) |
2.5 (0.1) |
2.5 (0.1) |
7.6 (0.3) |
15 (0.6) |
36 (1.4) |
43 (1.7) |
340 (13.5) |
| Source: Weatherbase | |||||||||||||
Demographics
2010
At the 2010 census Orcutt had a population of 28,905. The population density was 2,597.2 people per square mile (1,002.8/km2). The racial makeup of Orcutt was 22,680 (80.6%) White, 394 (1.4%) African American, 347 (1.2%) Native American, 1,129 (3.9%) Asian, 60 (0.2%) Pacific Islander, 235 (0.9%) from other races, and 1,293 (4.5%) from two or more races. Hispanic or Latino of any race were 5,630 persons (20%).
The census reported that 28,792 people (99.6% of the population) lived in households, 86 (0.3%) lived in non-institutionalized group quarters, and 27 (0.1%) were institutionalized.
There were 10,631 households, 3,638 (34.2%) had children under the age of 18 living in them, 6,272 (59.0%) were opposite-sex married couples living together, 1,130 (10.6%) had a female householder with no husband present, 481 (4.5%) had a male householder with no wife present. There were 417 (3.9%) unmarried opposite-sex partnerships, and 57 (0.5%) same-sex married couples or partnerships. 2,279 households (21.4%) were one person and 1,300 (12.2%) had someone living alone who was 65 or older. The average household size was 2.71. There were 7,883 families (74.2% of households); the average family size was 3.14.
The age distribution was 7,034 people (24.3%) under the age of 18, 2,295 people (7.9%) aged 18 to 24, 6,157 people (21.3%) aged 25 to 44, 8,327 people (28.8%) aged 45 to 64, and 5,092 people (17.6%) who were 65 or older. The median age was 42.3 years. For every 100 females, there were 96.1 males. For every 100 females age 18 and over, there were 92.7 males.
There were 11,133 housing units at an average density of 1,000.3 per square mile, of the occupied units 8,304 (78.1%) were owner-occupied and 2,327 (21.9%) were rented. The homeowner vacancy rate was 1.9%; the rental vacancy rate was 4.5%. 22,043 people (76.3% of the population) lived in owner-occupied housing units and 6,749 people (23.3%) lived in rental housing units.
2000
At the 2000 census there were 28,830 people, 10,420 households, and 8,023 families in the CDP. The population density was 2,551.0 people per square mile (985.1/km2). There were 10,640 housing units at an average density of 941.5 per square mile (363.6/km2). The racial makeup of the CDP was 86.68% White, 1.40% African American, 0.92% Native American, 3.20% Asian, 0.08% Pacific Islander, 3.91% from other races, and 3.81% from two or more races. Hispanic or Latino of any race were 14.45%.
Of the 10,420 households 35.1% had children under the age of 18 living with them, 65.0% were married couples living together, 8.6% had a female householder with no husband present, and 23.0% were non-families. 19.1% of households were one person and 10.4% were one person aged 65 or older. The average household size was 2.74 and the average family size was 3.14.
The age distribution was 27.0% under the age of 18, 6.1% from 18 to 24, 25.2% from 25 to 44, 24.0% from 45 to 64, and 17.7% 65 or older. The median age was 40 years. For every 100 females, there were 95.0 males. For every 100 females age 18 and over, there were 90.4 males.
The median household income was $53,251 and the median family income was $59,865. Males had a median income of $49,035 versus $30,700 for females. The per capita income for the CDP was $23,373. About 2.6% of families and 4.6% of the population were below the poverty line, including 4.7% of those under age 18 and 5.3% of those age 65 or over.
Education
Children in Orcutt attend schools in the Orcutt Union School District. Schools in Orcutt Union School District, compared to other schools in California, rate in the 70th and 80th percentiles.
See also
 In Spanish: Orcutt (California) para niños


