
Peak oil facts for kids


Peak oil is the idea that at some point an oil well, an oil field, a country, or the world, will be producing the most crude oil it can ever produce at one time. After this point, less oil will be produced and therefore people will have to use less oil because it will cost more money. Many scientists and governments are concerned about what will happen when there is less oil to go around.
The first person to come up with this idea was M.K. Hubbert in the 1950s and 1960s, who said that a graph of oil production looks like a curve (which we now call Hubbert's Curve). Hubbert drew a graph in 1956 that predicted that the United States would reach its peak oil in the early 1970s. The United States did indeed reach its peak oil in the early 1970s.
It is unclear as to when the world's peak oil will happen, though many scientists agree that it was reached in the early 2000s or before 2020. For example, in 2010 the International Energy Agency (IEA) has said that peak oil may have happened in 2006.
Images for kids
-

Global consumption of oil 1980–2013 (Energy Information Administration)
-

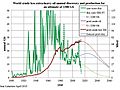
Global liquids production 2000–2015, indicating the component of US tight oil (Energy Information Administration)
-
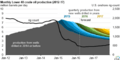
US Lower 48 oil production from 2012 and anticipated decline in production to the end of 2017, with rig count (Energy Information Administration)
-
World oil discoveries peaked in the 1960s
-
Although US proved oil reserves grew by 3.8 billion barrels in 2011, even after deducting 2.07 billion barrels of production, only 8 percent of the 5.84 billion barrels of the newly booked oil was because of new field discoveries (U.S. EIA)
-
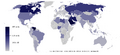
Proven oil reserves, 2013
-
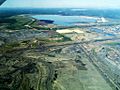
Syncrude's Mildred Lake mine site and plant near Fort McMurray, Alberta
-
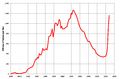
Texas oil production declined since peaking in 1972 but had a resurgence in the 2010s due to tight oil production
-
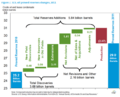
Unconventional resources are much larger than conventional ones.
-
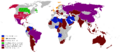
Oil producing countries (information from 2006 to 2012)
-
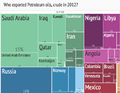
Crude oil export treemap (2012) from Harvard Atlas of Economic Complexity
-
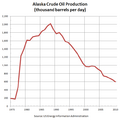
By 2007 Alaska's oil production had declined 70% since peaking in 1988
-
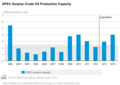
OPEC surplus crude oil production capacity, 2002–2012 (US EIA)
-
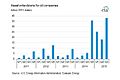
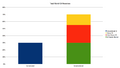
Asset write downs for oil companies 2015
-
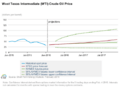
Depicts EIA projections for West Texas Intermediate crude oil price for 2016–2017
-
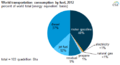
World transport energy use by fuel type 2012


See also
 In Spanish: Teoría del pico de Hubbert para niños
