South El Monte, California facts for kids
Quick facts for kids
South El Monte, California
|
|
|---|---|
| City of South El Monte | |

A great blue heron near South El Monte
|
|
| Motto(s):
"Growing Our Future"
|
|

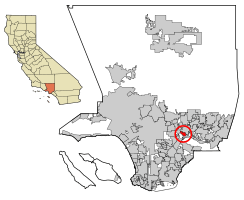
Location of South El Monte in Los Angeles County, California
|
|
| Country | |
| State | |
| County | |
| Incorporated | July 30, 1958 |
| Area | |
| • Total | 2.85 sq mi (7.38 km2) |
| • Land | 2.84 sq mi (7.36 km2) |
| • Water | 0.01 sq mi (0.01 km2) 0.19% |
| Elevation | 249 ft (76 m) |
| Population
(2010)
|
|
| • Total | 20,116 |
| • Estimate
(2019)
|
20,574 |
| • Density | 7,236.72/sq mi (2,794.33/km2) |
| Time zone | UTC-8 (Pacific) |
| • Summer (DST) | UTC-7 (PDT) |
| ZIP code |
91733
|
| Area code | 626 |
| FIPS code | 06-72996 |
| GNIS feature ID | 1656635 |
South El Monte is a city in the San Gabriel Valley, in Los Angeles County, California, United States. As of the 2010 census, the city had a population of 20,116, down from 21,144 at the 2000 census.
Geography
According to the United States Census Bureau, the city has a total area of 2.8 square miles (7.4 km²), virtually all land.
Demographics
| Historical population | |||
|---|---|---|---|
| Census | Pop. | %± | |
| 1960 | 4,850 | — | |
| 1970 | 13,443 | 177.2% | |
| 1980 | 16,623 | 23.7% | |
| 1990 | 20,850 | 25.4% | |
| 2000 | 21,144 | 1.4% | |
| 2010 | 20,116 | −4.9% | |
| 2019 (est.) | 20,574 | 2.3% | |
| U.S. Decennial Census | |||
2010
At the 2010 census South El Monte had a population of 20,116. The population density was 7,061.5 people per square mile (2,726.4/km2). The racial makeup of South El Monte was 10,136 (50.4%) White (3.4% Non-Hispanic White), 107 (0.5%) African American, 250 (1.2%) Native American, 2,211 (11.0%) Asian, 12 (0.1%) Pacific Islander, 6,718 (33.4%) from other races, and 682 (3.4%) from two or more races. Hispanic or Latino of any race were 17,079 persons (84.9%).
The census reported that 20,059 people (99.7% of the population) lived in households, 47 (0.2%) lived in non-institutionalized group quarters, and 10 (0%) were institutionalized.
There were 4,569 households, 2,643 (57.8%) had children under the age of 18 living in them, 2,554 (55.9%) were opposite-sex married couples living together, 925 (20.2%) had a female householder with no husband present, 524 (11.5%) had a male householder with no wife present. There were 329 (7.2%) unmarried opposite-sex partnerships, and 21 (0.5%) same-sex married couples or partnerships. 397 households (8.7%) were one person and 208 (4.6%) had someone living alone who was 65 or older. The average household size was 4.39. There were 4,003 families (87.6% of households); the average family size was 4.45.
The age distribution was 6,041 people (30.0%) under the age of 18, 2,323 people (11.5%) aged 18 to 24, 5,894 people (29.3%) aged 25 to 44, 4,062 people (20.2%) aged 45 to 64, and 1,796 people (8.9%) who were 65 or older. The median age was 30.4 years. For every 100 females, there were 101.9 males. For every 100 females age 18 and over, there were 101.2 males.
There were 4,711 housing units at an average density of 1,653.7 per square mile, of the occupied units 2,208 (48.3%) were owner-occupied and 2,361 (51.7%) were rented. The homeowner vacancy rate was 0.7%; the rental vacancy rate was 3.5%. 9,304 people (46.3% of the population) lived in owner-occupied housing units and 10,755 people (53.5%) lived in rental housing units.
According to the 2010 United States Census, South El Monte had a median household income of $44,104, with 19.4% of the population living below the federal poverty line.
2000
At the 2000 census there were 21,144 people in 4,620 households, including 4,088 families, in the city. The population density was 7,330.8 inhabitants per square mile (2,834.6/km2). There were 4,724 housing units at an average density of 1,637.8 per square mile (633.3/km2). The racial makeup of the city was 40.61% White, 0.38% African American, 1.57% Native American, 8.43% Asian, 0.18% Pacific Islander, 43.98% from other races, and 4.84% from two or more races. Hispanic or Latino of any race were 86.03%.
Of the 4,620 households 52.0% had children under the age of 18 living with them, 61.0% were married couples living together, 17.5% had a female householder with no husband present, and 11.5% were non-families. 8.0% of households were one person and 3.9% were one person aged 65 or older. The average household size was 4.57 and the average family size was 4.61.
The age distribution was 33.5% under the age of 18, 13.0% from 18 to 24, 31.2% from 25 to 44, 15.0% from 45 to 64, and 7.2% 65 or older. The median age was 27 years. For every 100 females, there were 105.5 males. For every 100 females age 18 and over, there were 104.0 males.
The median household income was $24,656 and the median family income was $34,349. Males had a median income of $21,075 versus $18,949 for females. The per capita income for the city was $10,130. About 16.2% of families and 19.0% of the population were below the poverty line, including 22.7% of those under age 18 and 11.0% of those age 65 or over.
Education
Elementary school districts include:
- El Monte City School District
- Loma Elementary School
- Potrero Elementary School
- Mountain View School District
- Miramonte Elementary School
- Monte Vista Elementary School
- Valle Lindo School District
- New Temple Elementary School
- Dean L. Shively Elementary School
The El Monte Union High School District operates South El Monte High School.
Private Schools:
- Epiphany Catholic School
Asahi Gakuen, a part-time Japanese school, operates its San Gabriel campus (サンゲーブル校 Sangēburu-kō) at South El Monte High School.
Images for kids
-
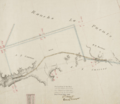
South El Monte sits on land that was originally part of Rancho La Puente, a Mexican era rancho grant.
See also
 In Spanish: South El Monte para niños


