
St. Clair County, Michigan facts for kids
Quick facts for kids
St. Clair County
|
||
|---|---|---|

|
||
|
||

Location within the U.S. state of Michigan
|
||
 Michigan's location within the U.S. |
||
| Country | ||
| State | ||
| Founded | March 28, 1820 (created) 1821 (organized) |
|
| Named for | St. Clare of Assisi | |
| Seat | Port Huron | |
| Largest city | Port Huron | |
| Area | ||
| • Total | 837 sq mi (2,170 km2) | |
| • Land | 721 sq mi (1,870 km2) | |
| • Water | 115 sq mi (300 km2) 14%% | |
| Population
(2020)
|
||
| • Total | 160,383 | |
| • Density | 226/sq mi (87/km2) | |
| Time zone | UTC−5 (Eastern) | |
| • Summer (DST) | UTC−4 (EDT) | |
| Area code | 810 | |
| Congressional district | 10th | |

St. Clair County is a county located in the U.S. state of Michigan and bordering the west bank of the St. Clair River. As of the 2020 Census, the population was 160,383. It is the 13th-most populous county in the state. The county seat is Port Huron, located at the north end of the St. Clair River at Lake Huron. The county was created September 10, 1820, and its government was organized in 1821. Located northeast of Detroit, St. Clair County is part of the Detroit-Warren-Dearborn, MI Metropolitan Statistical Area. Geographically, it lies in the Thumb area of eastern Michigan.
Demographics
| Historical population | |||
|---|---|---|---|
| Census | Pop. | %± | |
| 1830 | 1,114 | — | |
| 1840 | 4,606 | 313.5% | |
| 1850 | 10,420 | 126.2% | |
| 1860 | 26,604 | 155.3% | |
| 1870 | 36,661 | 37.8% | |
| 1880 | 46,197 | 26.0% | |
| 1890 | 52,105 | 12.8% | |
| 1900 | 55,228 | 6.0% | |
| 1910 | 52,341 | −5.2% | |
| 1920 | 58,009 | 10.8% | |
| 1930 | 67,563 | 16.5% | |
| 1940 | 76,222 | 12.8% | |
| 1950 | 91,599 | 20.2% | |
| 1960 | 107,201 | 17.0% | |
| 1970 | 120,175 | 12.1% | |
| 1980 | 138,802 | 15.5% | |
| 1990 | 145,607 | 4.9% | |
| 2000 | 164,235 | 12.8% | |
| 2010 | 163,040 | −0.7% | |
| 2020 | 160,383 | −1.6% | |
| U.S. Decennial Census 1790-1960 1900-1990 1990-2000 2010-2019 |
|||
The 2010 United States Census indicates St. Clair County had a 2010 population of 163,040. This is a decrease of -1,195 people from the 2000 United States Census. Overall, the county had a -0.7% growth rate during this ten-year period. In 2010 there were 63,841 households and 44,238 families in the county. The population density was 226.1 per square mile (87.3 square kilometers). There were 71,822 housing units at an average density of 99.6 per square mile (38.5 square kilometers). 93.9% were White, 2.4% Black or African American, 0.5% Asian, 0.4% Native American, 0.7% of some other race and 2.0% of two or more races. 2.9% were Hispanic or Latino (of any race). 25.9% identified as of German, 10.2% Polish, 9.3% Irish, 8.5% English, 6.5% French, 6.5% American, and 5.1% Italian ancestry.
There were 63,841 households, out of which 31.3% had children under the age of 18 living with them, 52.9% were opposite-sex families, 11.4% had a female householder with no husband present, 30.7% were non-families, and 25.5% were made up of individuals. The average household size was 2.52 and the average family size was 3.01.
In the county, the population was spread out, with 23.7% under age of 18, 8.0% from 18 to 24, 23.8% from 25 to 44, 30.1% from 45 to 64, and 14.5% who were 65 years of age or older. The median age was 41 years. For every 100 females, there were 98.1 males. For every 100 females age 18 and over, there were 95.7 males.
The 2010 American Community Survey 1-year estimate indicates the median income for a household in the county was $44,369 and the median income for a family was $53,207. Males had a median income of $30,056 versus $16,771 for females. The per capita income for the county was $22,390. About 10.4% of families and 15.4% of the population were below the poverty line, including 22.7% of those under the age 18 and 6.8% of those age 65 or over.
Images for kids
-
St. Clair County is also called the Blue Water Area.
-
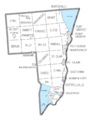
U.S. Census data map showing local municipal boundaries within St. Clair County. Shaded areas represent incorporated cities.


See also
 In Spanish: Condado de St. Clair (Míchigan) para niños
