
Usage share of web browsers facts for kids
The usage share of web browsers is the percentage (%) of viewers at a group of websites who use a particular web browser. For example, when it is said that Internet Explorer has 7% usage share (April 2018), it means that some version of Internet Explorer is used by nearly 7 of every 100 visitors who visit a given set of websites.
Contents
- Accuracy issues
- Summary table
- Historical usage share
- Older reports
- Wikimedia (April 2009 to June 2010)
- TheCounter.com (2000 to 2009)
- OneStat.com (April 2002 to March 2009)
- ADTECH (Europe, 2004 to Q4 2009)
- AT Internet Institute (Europe, July 2007 to June 2010)
- WebSideStory (USA, February 1999 to June 2006)
- GVU WWW user survey (January 1994 to October 1998)
- EWS Web Server at UIUC (1996 Q2 to 1998)
- ZD Market Intelligence (USA, January 1997 to January 1998)
- Zona Research (USA, January 1997 to July 1998)
- AdKnowledge (January 1998 to June 1998)
- Dataquest (1995 to 1997)
- International Data Corporation (USA, 1996 to 1997)
- Related pages
- Images for kids
Accuracy issues
It can be misleading to measure the browser usage in the number of requests (page hits) made by each user agent.
Overestimation
Not all requests are generated by a user, as a user agent can make requests at regular time intervals without user input. In this case the user's activity might be overestimated. Some examples:
- A web browser that refreshes the webpage at a regular time interval.
- A feed reader that requests the RSS or Atom feed at a regular time interval.
- Extra files like CSS hacks and JavaScript hacks are often sent to Internet Explorer.
- Gecko-based browsers (such as Firefox) can prefetch linked web pages, potentially increasing hits. Link prefetching in Gecko-based browsers is used on pages with enhanced markup, including Google search results.
- A user who revisits a site shortly after changing or upgrading browsers may be double-counted under some methodologies; overall numbers at the time of a new version's release may be skewed.
- Certain anti-virus products fake their user-agent to appear to be popular browsers. This is done to trick attack sites that might display clean content to the scanner, but not to the browser. The Register reported in June 2008 that traffic from AVG Linkscanner, using an IE6 user-agent, outstripped human link clicks by nearly 10 to 1.
- Many types of software, such as Web validators or crawlers, fetch web pages, and send fictitious user-agent strings to appear more like normal traffic.
- Browsers such as Safari maintain a dashboard of frequently visited sites. This generates hits to those sites on browser start or at times on launch of a new tab, in order to update the thumbnail images.
Underestimation
It is also possible to underestimate the usage share by using the number of requests, for example:
- A graphical browser typically results in more hits than a text browser, as it downloads files referred to by the HTML document (e.g., images, CSS, and JavaScript).
- Many browsers and download managers spoof a different user agent string to the web server to prevent erroneous or malicious browser sniffing which could result in receiving broken or incompatible code, or being completely blocked, and thus increasing the statistics for other browsers (as an example, prior to version 9, the Opera web browser had "Identify as Internet Explorer" as the default user setting). Sometimes you can detect these spoofing browsers based on other things but some people do not do it. (An example is Internet Explorer Mobile which ships in Windows Mobile 6.1.4 and 6.5 with the default user agent string as IE6 Windows XP. Internet Explorer Mobile can be identified by looking at the other HTTP Headers)
- Text-based and audio-based browsers do not download any web bugs at all.
- Gecko-based browsers since Firefox 1.5 and Opera use fast Document Object Model (DOM) caching. JavaScript is only executed on pageload from net or disk cache, but not if it is loaded from DOM cache. This can have an impact on JavaScript based tracking of browser statistics.
- Some browser extensions and security programs (such as the popular Firefox extension NoScript) block JavaScript, Adobe Flash, Applets and some forms of HTML (HTML blocked through ClearClick) for non-whitelisted sites. This may also affect JavaScript based tracking of browser statistics.
- Many browsers accessing a site via one proxy are apt to be counted as only one access if the proxy caches the result; it is usual for browsers on mobile phones in particular to access the web via proxies (many of which violate HTTP's specifications for proxies; even if a web bug is designed to work despite proxying, the proxies run by mobile operators may well mislead it).
- While most browsers generate additional page hits by refreshing web pages when user navigates back through page history, some browsers (such as Opera) reuse cached content without resending requests to the server.
- Generally, the more faithfully a browser implements HTTP's cache specifications, the more it will be under-reported relative to browsers that implement those specifications poorly.
- Plug-ins may change, or append text to, the User Agent string. This can lead to Browser Detection flaws.
- User Agents are not guaranteed to be a certain format. As an example of the inconsistency, almost every User Agent pretends to be Mozilla 5.0.
- Some ISPs, mainly mobile phone carriers, have begun stripping the user agent strings.
Summary table
The following table summarizes the usage share of browsers for all platforms.
| Browser | StatCounter June 2018 |
NetMarketShare May 2018 |
Wikimedia May 2018 |
|---|---|---|---|
| Chrome | 58.94% | 60.60% | 47.77% |
| Safari | 13.70% | 17.27% | 22.16% |
| UC | 7.46% | 1.69% | 0.32% |
| Firefox | 5.17% | 5.89% | 6.21% |
| Opera | 3.50% | 2.07% | 1.16% |
| IE | 3.12% | 5.85% | 7.30% |
| Samsung Internet | 2.67% | N/A | 0.74% |
| Edge | 1.89% | 2.06% | 1.93% |
| AOSP | 1.56% | 1.10% | 1.02% |
| Others | 2.01% | 3.47% | 11.39% |
Net Applications (2004 Q4 to present)
.svg)
Netapplications bases its usage share mainly on the usage statistics of 40,000 websites having around 160 million unique visitors.
On 2009-08-01, Net Applications began weighting its raw data based on the number of internet users in the countries concerned, using data from the CIA ; the changes were applied retroactively to older data. The table below uses weighted data from 2007 Q4 onwards.
| Period |
Internet Explorer |
Firefox |
Chrome |
Safari |
Opera |
Netscape |
Mozilla |
|---|---|---|---|---|---|---|---|
| 2010 Q2 | 60.01% | 24.24% | 7.00% | 4.78% | 2.33% | 0.49% | 0.12% |
| 2010 Q1 | 61.43% | 24.40% | 5.67% | 4.55% | 2.37% | 0.52% | 0.15% |
| 2009 Q4 | 63.67% | 24.46% | 4.04% | 4.41% | 2.29% | 0.32% | 0.11% |
| 2009 Q3 | 66.80% | 23.06% | 2.86% | 4.13% | 2.07% | 0.50% | 0.09% |
| 2009 Q2 | 68.06% | 23.00% | 2.13% | 3.67% | 2.05% | 0.68% | 0.06% |
| 2009 Q1 | 69.13% | 22.67% | 1.56% | 3.58% | 2.18% | 0.51% | 0.06% |
| 2008 Q4 | 71.99% | 20.78% | 1.16% | 3.11% | 2.15% | 0.41% | 0.07% |
| 2008 Q3 | 74.93% | 19.07% | 0.37% | 2.73% | 2.06% | 0.43% | 0.07% |
| 2008 Q2 | 76.24% | 18.16% | 2.73% | 1.97% | 0.48% | 0.08% | |
| 2008 Q1 | 77.83% | 16.86% | 2.65% | 1.84% | 0.41% | 0.13% | |
| 2007 Q4 | 79.16% | 15.84% | 2.39% | 1.78% | 0.50% | 0.09% | |
| 2007 Q3 | 78.85% | 14.69% | 4.80% | 0.51% | 0.76% | 0.11% | |
| 2007 Q2 | 78.76% | 14.92% | 4.66% | 0.46% | 0.83% | 0.15% | |
| 2007 Q1 | 79.38% | 14.35% | 4.70% | 0.50% | 0.77% | 0.19% | |
| 2006 Q4 | 80.69% | 13.50% | 4.06% | 0.56% | 0.86% | 0.23% | |
| 2006 Q3 | 82.88% | 11.89% | 3.30% | 0.62% | 0.88% | 0.26% | |
| 2006 Q2 | 84.03% | 10.67% | 3.25% | 0.57% | 0.98% | 0.32% | |
| 2006 Q1 | 85.01% | 9.77% | 3.10% | 0.53% | 1.09% | 0.36% | |
| 2005 Q4 | 85.88% | 9.00% | 2.80% | 0.54% | 1.25% | 0.43% | |
| 2005 Q3 | 86.74% | 7.97% | 2.24% | 0.55% | 1.92% | 0.48% | |
| 2005 Q2 | 87.24% | 8.08% | 1.89% | 0.52% | 1.62% | 0.59% | |
| 2005 Q1 | 89.02% | 6.17% | 1.70% | 0.49% | 1.89% | 0.67% | |
| 2004 Q4 | 91.35% | 3.66% | 1.50% | 0.51% | 2.09% | 0.80% | |
| Period |
Internet Explorer |
Firefox |
Chrome |
Safari |
Opera |
Netscape |
Mozilla |
W3Counter (May 2007 to present)
This site counts the last 15,000 page views from each of approximately 30,000 websites. This limits the influence of sites with more than 15,000 visitors on the usage statistics.
| Date |
Internet Explorer |
Firefox |
Chrome |
Safari |
Opera |
Other Mozilla |
|---|---|---|---|---|---|---|
| August 2010 | 43.2% | 31.2% | 10.7% | 4.2% | 1.4% | |
| July 2010 | 44.4% | 31.4% | 9.8% | 1.9% | 2.1% | |
| June 2010 | 45.5% | 31.8% | 9.2% | 3.5% | 2.1% | |
| May 2010 | 45.7% | 32.2% | 8.4% | 5.3% | 2.0% | |
| April 2010 | 46.9% | 31.6% | 8.0% | 5.4% | 2.1% | |
| March 2010 | 47.9% | 32.3% | 7.4% | 5.5% | 2.1% | |
| February 2010 | 48.7% | 32.1% | 6.8% | 5.6% | 2.1% | |
| January 2010 | 49.7% | 32.3% | 6.3% | 5.4% | 2.1% | |
| December 31, 2009 | 50.3% | 32.3% | 5.5% | 5.1% | 2.1% | |
| November 30, 2009 | 51.2% | 32.0% | 4.7% | 5.2% | 1.2% | |
| October 31, 2009 | 51.3% | 32.1% | 4.2% | 5.1% | 2.0% | |
| September 30, 2009 | 51.8% | 31.9% | 3.7% | 5.0% | 2.0% | |
| August 31, 2009 | 52.4% | 32.1% | 3.6% | 4.9% | 1.9% | |
| July 31, 2009 | 53.1% | 31.7% | 3.3% | 4.6% | 1.8% | 1.1% |
| June 30, 2009 | 57.1% | 31.6% | 3.2% | 2.0% | 1.0% | |
| May 31, 2009 | 57.5% | 31.4% | 3.1% | 2.0% | 1.0% | |
| April 30, 2009 | 57.6% | 31.6% | 2.9% | 2.0% | 1.0% | |
| March 31, 2009 | 57.8% | 31.5% | 2.8% | 2.0% | 1.1% | |
| February 28, 2009 | 58.1% | 31.3% | 2.7% | 2.0% | 1.1% | |
| January 31, 2009 | 58.4% | 31.1% | 2.7% | 2.0% | 1.1% | |
| December 31, 2008 | 58.6% | 31.1% | 2.9% | 2.1% | 1.1% | |
| November 30, 2008 | 59.0% | 30.8% | 3.0% | 2.0% | 1.0% | |
| October 31, 2008 | 59.4% | 30.6% | 3.0% | 2.0% | 1.0% | |
| September 30, 2008 | 57.3% | 32.5% | 2.7% | 2.0% | 1.0% | |
| August 31, 2008 | 58.7% | 31.4% | 2.4% | 2.1% | 0.9% | |
| July 31, 2008 | 60.9% | 29.7% | 2.4% | 2.0% | 1.0% | |
| June 30, 2008 | 61.7% | 29.1% | 2.5% | 2.0% | 0.9% | |
| May 31, 2008 | 61.9% | 28.9% | 2.7% | 2.0% | 0.9% | |
| April 30, 2008 | 62.0% | 28.8% | 2.8% | 2.0% | 0.9% | |
| March 31, 2008 | 62.0% | 28.8% | 2.8% | 2.0% | 0.9% | |
| February 29, 2008 | 62.0% | 28.7% | 2.8% | 2.0% | 0.9% | |
| January 31, 2008 | 62.2% | 28.7% | 2.7% | 2.0% | 0.52% | |
| December 1, 2007 | 62.8% | 28.0% | 2.6% | 2.0% | 0.56% | |
| November 10, 2007 | 63.0% | 27.8% | 2.5% | 2.0% | 0.59% | |
| October 30, 2007 | 65.5% | 26.3% | 2.3% | 1.8% | 0.59% | |
| September 20, 2007 | 66.6% | 25.6% | 2.1% | 1.8% | 0.61% | |
| August 30, 2007 | 66.7% | 25.5% | 2.1% | 1.8% | 0.62% | |
| July 30, 2007 | 66.9% | 25.1% | 2.2% | 1.8% | 0.67% | |
| June 30, 2007 | 66.9% | 25.1% | 2.3% | 1.8% | 0.70% | |
| May 30, 2007 | 67.1% | 24.8% | 2.4% | 1.8% | 0.67% | |
| Date |
Internet Explorer |
Firefox |
Chrome |
Safari |
Opera |
Other Mozilla |
StatCounter (July 2008 to present)
Statcounter statistics are directly derived from hits (not unique visitors) from 3 million sites using Statcounter totalling more than 15 billion hits per month. No artificial weightings are used.
| Date |
Internet Explorer |
Firefox |
Chrome |
Safari |
Opera |
Netscape |
|---|---|---|---|---|---|---|
| August 2010 | 51.34% | 31.09% | 10.76% | 4.23% | 1.88% | |
| July 2010 | 52.68% | 30.69% | 9.88% | 4.09% | 1.91% | |
| June 2010 | 52.86% | 31.15% | 9.24% | 4.07% | 1.91% | |
| May 2010 | 52.77% | 31.64% | 8.61% | 4.14% | 1.96% | |
| April 2010 | 53.26% | 31.74% | 8.06% | 4.23% | 1.82% | |
| March 2010 | 54.44% | 31.27% | 7.29% | 4.16% | 1.97% | |
| February 2010 | 54.50% | 31.83% | 6.71% | 4.08% | 1.97% | |
| January 2010 | 55.25% | 31.64% | 6.04% | 3.76% | 2.00% | |
| December 2009 | 55.72% | 31.97% | 5.45% | 3.48% | 2.06% | |
| November 2009 | 56.57% | 32.21% | 4.66% | 3.67% | 2.02% | |
| October 2009 | 57.96% | 31.82% | 4.17% | 3.47% | 1.88% | |
| September 2009 | 58.37% | 31.34% | 3.69% | 3.28% | 2.62% | |
| August 2009 | 58.69% | 31.28% | 3.38% | 3.25% | 2.67% | |
| July 2009 | 60.11% | 30.50% | 3.01% | 3.02% | 2.64% | |
| June 2009 | 59.49% | 30.26% | 2.80% | 2.91% | 3.46% | |
| May 2009 | 62.09% | 28.75% | 2.42% | 2.65% | 3.23% | |
| April 2009 | 61.88% | 29.67% | 2.07% | 2.75% | 2.96% | |
| March 2009 | 62.52% | 29.40% | 1.73% | 2.73% | 2.94% | |
| February 2009 | 64.43% | 27.85% | 1.52% | 2.59% | 2.95% | |
| January 2009 | 65.41% | 27.03% | 1.38% | 2.57% | 2.92% | |
| December 2008 | 67.84% | 25.23% | 1.21% | 2.41% | 2.83% | |
| November 2008 | 68.14% | 25.27% | 0.93% | 2.49% | 3.01% | |
| October 2008 | 67.68% | 25.54% | 1.02% | 2.91% | 2.69% | |
| September 2008 | 67.16% | 25.77% | 1.03% | 3.00% | 2.86% | |
| August 2008 | 68.91% | 26.08% | 2.99% | 1.83% | 0.07% | |
| July 2008 | 68.57% | 26.14% | 3.30% | 1.78% | 0.07% |
StatCounter Europe (July 2008 to present)
| Date |
Internet Explorer |
Firefox |
Opera |
Chrome |
Safari |
|---|---|---|---|---|---|
| August 2010 | 42.01% | 37.94% | 4.33% | 10.81% | 4.11% |
| July 2010 | 42.61% | 37.98% | 4.55% | 10.13% | 3.89% |
| June 2010 | 43.18% | 38.09% | 4.40% | 9.60% | 3.90% |
| May 2010 | 43.32% | 38.61% | 4.41% | 8.89% | 3.88% |
| April 2010 | 44.10% | 38.72% | 4.15% | 8.27% | 3.80% |
| March 2010 | 45.32% | 38.28% | 4.32% | 7.36% | 3.76% |
| February 2010 | 45.50% | 38.99% | 4.29% | 6.52% | 3.67% |
| January 2010 | 44.91% | 39.86% | 4.33% | 5.78% | 3.68% |
| December 2009 | 44.84% | 40.8% | 4.44% | 5.06% | 3.40% |
| November 2009 | 46.57% | 40.12% | 4.27% | 4.43% | 3.52% |
| October 2009 | 47.78% | 39.87% | 4.05% | 3.99% | 3.37% |
| September 2009 | 46.44% | 39.26% | 6.64% | 3.59% | 3.14% |
| August 2009 | 46.01% | 39.62% | 7.12% | 3.36% | 2.95% |
| July 2009 | 46.69% | 39.70% | 6.84% | 3.05% | 2.81% |
| June 2009 | 45.97% | 38.79% | 8.69% | 2.78% | 2.64% |
| May 2009 | 46.65% | 38.59% | 8.75% | 2.49% | 2.52% |
| April 2009 | 47.89% | 39.04% | 7.63% | 2.05% | 2.53% |
| March 2009 | 49.13% | 38.54% | 7.34% | 1.73% | 2.43% |
| February 2009 | 50.29% | 37.69% | 7.29% | 1.49% | 2.38% |
| January 2009 | 50.48% | 37.71% | 7.25% | 1.38% | 2.30% |
| December 2008 | 51.84% | 36.70% | 7.35% | 1.25% | 2.25% |
| November 2008 | 55.08% | 33.74% | 7.77% | 0.91% | 2.30% |
| October 2008 | 56.52% | 33.41% | 6.38% | 0.98% | 2.52% |
| September 2008 | 56.35% | 33.77% | 6.20% | 1.04% | 2.45% |
| August 2008 | 58.31% | 35.53% | 3.49% | 2.47% | |
| July 2008 | 58.19% | 35.52% | 3.69% | 2.37% |
StatOwl.com (September 2008 to present)
| Period |
Internet Explorer |
Mozilla / Firefox |
Chrome |
Safari |
Opera |
Gecko |
Netscape Navigator |
|---|---|---|---|---|---|---|---|
| August 2010 | 62.66% | 20.94% | 6.83% | 8.83% | 0.35% | 0.14% | |
| July 2010 | 61.73% | 21.66% | 6.95% | 8.94% | 0.36% | ||
| June 2010 | 63.37% | 21.26% | 6.24% | 8.52% | 0.33% | ||
| May 2010 | 64.17% | 21.12% | 5.59% | 8.31% | 0.37% | ||
| April 2010 | 64.55% | 21.35% | 5.23% | 8.12% | 0.40% | ||
| March 2010 | 66.34% | 19.90% | 4.39% | 8.59% | 0.31% | ||
| February 2010 | 66.99% | 19.48% | 3.98% | 9.00% | 0.24% | 0.06% | |
| January 2010 | 66.33% | 20.31% | 3.87% | 8.94% | 0.26% | 0.06% | |
| December 2009 | 66.12% | 20.82% | 3.51% | 8.73% | 0.30% | 0.07% | |
| November 2009 | 67.74% | 20.15% | 2.88% | 8.56% | 0.28% | 0.10% | |
| October 2009 | 68.38% | 20.32% | 2.56% | 8.09% | 0.27% | 0.14% | |
| September 2009 | 67.25% | 21.12% | 2.41% | 8.46% | 0.28% | 0.21% | |
| August 2009 | 68.37% | 21.32% | 2.21% | 7.29% | 0.28% | 0.23% | |
| July 2009 | 69.29% | 21.06% | 2.05% | 6.77% | 0.30% | 0.24% | |
| June 2009 | 71.44% | 19.48% | 1.93% | 6.30% | 0.33% | 0.22% | |
| May 2009 | 71.35% | 20.26% | 1.64% | 5.95% | 0.31% | 0.21% | |
| April 2009 | 71.38% | 20.46% | 1.43% | 5.80% | 0.31% | 0.19% | |
| March 2009 | 72.03% | 20.00% | 1.19% | 5.91% | 0.30% | 0.10% | |
| February 2009 | 74.04% | 18.64% | 0.97% | 5.57% | 0.27% | 0.10% | |
| January 2009 | 73.05% | 19.39% | 0.96% | 5.72% | 0.29% | 0.12% | |
| December 2008 | 70.89% | 20.87% | 0.95% | 6.32% | 0.33% | 0.13% | |
| November 2008 | 72.07% | 19.78% | 0.68% | 6.57% | 0.29% | 0.13% | |
| October 2008 | 73.45% | 18.88% | 0.57% | 6.22% | 0.26% | 0.16% | |
| September 2008 | 74.53% | 18.14% | 0.52% | 5.98% | 0.22% | 0.17% |
Clicky (Late September 2009 to present)
| Period |
Internet Explorer |
Firefox |
Chrome |
Safari |
Opera |
Mozilla |
|---|---|---|---|---|---|---|
| August 2010 | 48.23% | 30.82% | 11.22% | 8.24% | 1.31% | 0.16% |
| July 2010 | 49.26% | 30.88% | 10.53% | 7.87% | 1.26% | 0.18% |
| June 2010 | 49.44% | 31.16% | 10.30% | 7.64% | 1.25% | 0.20% |
| May 2010 | 49.03% | 32.12% | 9.53% | 7.73% | 1.34% | 0.24% |
| April 2010 | 48.90% | 32.73% | 8.94% | 7.81% | 1.39% | 0.22% |
| March 2010 | 49.91% | 32.37% | 8.20% | 7.89% | 1.40% | 0.21% |
| February 2010 | 49.92% | 32.80% | 7.54% | 8.09% | 1.41% | 0.23% |
| January 2010 | 50.71% | 32.89% | 6.85% | 7.79% | 1.51% | 0.23% |
| December 2009 | 50.87% | 33.40% | 6.17% | 7.70% | 1.58% | 0.25% |
| November 2009 | 52.21% | 32.97% | 5.15% | 7.80% | 1.55% | 0.31% |
| October 2009 | 53.10% | 32.71% | 4.66% | 7.68% | 1.45% | 0.37% |
| September 2009 | 54.58% | 31.96% | 4.25% | 7.44% | 1.34% | 0.41% |
Older reports
Wikimedia (April 2009 to June 2010)
Wikimedia squid reports are based on server logs of about 4 billion page requests per month, based on the user agent information that accompanied the requests. These server logs cover requests to the following Wikimedia Foundation projects: Wikipedia, Wikimedia Commons, Wiktionary, Wikibooks, Wikiquote, Wikisource, Wikinews, Wikiversity and others.
| Period |
Internet Explorer |
Firefox |
Chrome |
Safari |
Opera |
Mozilla |
|---|---|---|---|---|---|---|
| June 2010 | 47.50% | 30.90% | 7.39% | 4.95% | 3.43% | 0.59% |
| May 2010 | 48.25% | 30.87% | 6.93% | 4.99% | 3.46% | 0.62% |
| April 2010 | 48.96% | 30.84% | 6.37% | 5.09% | 3.40% | 0.69% |
| March 2010 | 50.43% | 30.44% | 5.75% | 5.14% | 3.30% | 0.62% |
| February 2010 | 50.29% | 30.96% | 5.28% | 5.27% | 3.29% | 0.60% |
| January 2010 | 51.01% | 30.85% | 4.81% | 5.13% | 3.18% | 0.56% |
| December 2009 | 52.24% | 30.45% | 4.34% | 5.14% | 3.08% | 0.57% |
| November 2009 | 54.43% | 29.96% | 3.73% | 4.96% | 2.82% | 0.63% |
| October 2009 | 54.72% | 30.17% | 3.41% | 4.82% | 2.76% | 0.65% |
| September 2009 | 55.77% | 29.78% | 3.12% | 4.72% | 2.62% | 0.67% |
| August 2009 | 55.60% | 30.25% | 2.97% | 4.57% | 2.97% | 0.71% |
| July 2009 | 54.55% | 31.52% | 2.77% | 4.51% | 2.38% | 0.70% |
| June 2009 | 56.35% | 30.82% | 2.45% | 4.04% | 2.61% | 0.64% |
| May 2009 | 57.30% | 30.43% | 2.28% | 3.76% | 2.65% | 0.66% |
| April 2009 | 57.37% | 30.71% | 1.93% | 3.86% | 2.57% | 0.68% |
TheCounter.com (2000 to 2009)
.gif)
TheCounter.com identifies sixteen versions of six browsers (Internet Explorer, Firefox, Safari, Opera, Netscape, and Konqueror). Other browsers are categorised as either ‘Netscape compatible’ (including Google Chrome, which may also be categorized as 'Safari' due to its 'Webkit' subtag) or ‘unknown’. Internet Explorer 8 is identified as Internet Explorer 7. Monthly data includes all hits from 2008-02-01 until the end of the month concerned. More than the exact browser type, this data identifies the underlying web rendering engine used by various browsers, and the table below aggregates them in the same column.
| Period |
Internet Explorer |
Netscape / Mozilla / Firefox |
Safari |
Opera |
Netscape Navigator |
Sources |
|---|---|---|---|---|---|---|
| 2009 Q4 | 66.42% | 21.13% | 10.05% | 1.00% | 0.05% | Oct , Nov , Dec |
| 2009 Q3 | 69.07% | 20.59% | 8.10% | 0.89% | 0.06% | Jul , Aug , Sep |
| 2009 Q2 | 70.31% | 20.12% | 6.44% | 0.94% | 0.06% | Apr , May , Jun |
| 2009 Q1 | 71.25% | 20.01% | 5.47% | 0.92% | 0.08% | Jan , Feb , Mar |
| 2008 Q4 | 74.24% | 18.66% | 4.52% | 0.89% | 0.07% | Oct , Nov , Dec |
| 2008 Q3 | 76.33% | 17.97% | 3.76% | 0.84% | 0.07% | Jul , Aug , Sep |
| 2008 Q2 | 78.30% | 16.36% | 3.41% | 0.81% | 0.06% | Apr , May , Jun |
| 2008 Q1 | 78.80% | 15.87% | 3.32% | 0.79% | 0.06% | Jan , Feb , Mar |
| 2007 Q4 | 81.14% | 13.81% | 3.21% | 0.67% | 0.06% | Oct , Nov , Dec |
| 2007 Q3 | 81.63% | 13.49% | 3.00% | 0.66% | 0.06% | Jul , Aug , Sep |
| 2007 Q2 | 82.97% | 12.41% | 2.87% | 0.64% | 0.06% | Apr , May , Jun |
| 2007 Q1 | 83.69% | 11.57% | 2.92% | 0.57% | 0.06% | Jan , Feb , Mar |
| 2006 Q4 | 84.11% | 11.13% | 2.80% | 0.60% | 0.05% | Nov , Dec |
| 2006 Q3 | 84.48% | 10.56% | 2.27% | 0.73% | 0.06% | Jul , Aug , Sep |
| 2006 Q2 | 86.32% | 9.03% | 1.89% | 0.70% | 0.05% | Apr , May , Jun |
| 2006 Q1 | 90.01% | 6.77% | 1.40% | 0.58% | 0.05% | Jan , Feb , Mar |
| 2005 Q4 | 87.25% | 8.60% | 1.83% | 0.71% | 0.07% | Oct , Nov , Dec |
| 2005 Q3 | 87.58% | 8.42% | 1.60% | 0.67% | 0.07% | Jul , Aug , Sep |
| 2005 Q2 | 90.90% | 6.02% | 0.99% | 0.51% | 0.09% | Apr , May , Jun |
| 2005 Q1 | 90.77% | 5.73% | 1.00% | 0.54% | 0.11% | Jan , Feb , Mar |
| 2004 Q4 | 90.98% | 5.10% | 0.77% | 0.68% | 0.18% | Oct , Nov , Dec |
| 2004 Q3 | 92.70% | 3.57% | 0.73% | 0.65% | 0.20% | Jul , Aug , Sep |
| 2004 Q2 | 95.04% | 2.37% | 0.67% | 0.51% | 0.32% | Apr , May , Jun |
| 2004 Q1 | 94.28% | 2.70% | 0.52% | 0.36% | Jan , Feb , Mar | |
| 2003 Q4 | Oct , Nov , Dec | |||||
| 2003 Q3 | Jul , Aug , Sep | |||||
| 2003 Q2 | 94.43% | 2.22% | 0.66% | 1.45% | Apr , May , Jun | |
| 2003 Q1 | 94.18% | 2.15% | 0.65% | 1.77% | Jan , Feb , Mar | |
| 2002 Q4 | 93.94% | 1.67% | 0.83% | 2.31% | Oct, Nov , Dec | |
| 2002 Q3 | 93.32% | 1.36% | 0.94% | 3.04% | Jul , Aug , Sep | |
| 2002 Q2 | 92.47% | 1.13% | 0.82% | 4.13% | Apr , May , Jun | |
| 2002 Q1 | 92.40% | 0.93% | 0.52% | 4.67% | Jan , Feb , Mar | |
| 2001 Q4 | 90.83% | 0.71% | 0.36% | 5.23% | Oct , Nov , Dec | |
| 2001 Q3 | 88.43% | 0.26% | 0.31% | 6.49% | Jul , Aug , Sep | |
| 2001 Q2 | 87.99% | 0.27% | 0.28% | 7.46% | Apr , May , Jun | |
| 2001 Q1 | 86.80% | 0.30% | 0.22% | 9.84% | Jan , Feb , Mar | |
| 2000 Q4 | 83.95% | 0.14% | 0.14% | 12.61% | Oct , Nov , Dec | |
| 2000 Q3 | 82.76% | 0.04% | 0.14% | 14.35% | Jul , Aug , Sep | |
| 2000 Q2 | 80.30% | 0.02% | 0.12% | 17.54% | Apr , May , Jun | |
| 2000 Q1 | 79.09% | 0.00% | 0.13% | 19.25% | Jan , Feb , Mar | |
| Period |
Internet Explorer |
Netscape / Mozilla / Firefox |
Safari |
Opera |
Netscape Navigator |
Sources |
OneStat.com (April 2002 to March 2009)
| Period |
Internet Explorer |
Mozilla / Firefox |
Safari |
Chrome |
Opera |
Netscape |
Netscape Navigator |
|---|---|---|---|---|---|---|---|
| March 2009 | 79.59% | 15.59% | 2.65% | 0.86% | 0.54% | 0.31% | |
| November 2008 | 81.36% | 14.67% | 2.42% | 0.54% | 0.55% | 0.32% | |
| February 2008 | 83.27% | 13.76% | 2.18% | 0.55% | 0.14% | ||
| June 2007 | 84.66% | 12.72% | 1.79% | 0.61% | 0.11% | ||
| January 2007 | 85.81% | 11.69% | 1.64% | 0.58% | 0.13% | ||
| November 2006 | 85.24% | 12.15% | 1.61% | 0.69% | 0.11% | ||
| October 2006 | 85.85% | 11.49% | 1.61% | 0.69% | 0.12% | ||
| July 2006 | 83.05% | 12.93% | 1.84% | 1.00% | 0.16% | ||
| May 2006 | 85.17% | 11.79% | 2.02% | 0.79% | 0.15% | ||
| January 2006 | 85.82% | 11.23% | 1.88% | 0.77% | 0.16% | ||
| November 2005 | 85.45% | 11.51% | 1.75% | 0.77% | 0.26% | ||
| April 2005 | 86.63% | 8.69% | 1.26% | 1.03% | 1.08% | ||
| February 2005 | 87.28% | 8.45% | 1.21% | 1.09% | 1.11% | ||
| November 2004 | 88.90% | 7.35% | 0.91% | 1.33% | |||
| May 2004 | 93.9% | 2.1% | 0.71% | 1.02% | |||
| January 2004 | 94.8% | 1.8% | 0.48% | 0.8% | |||
| July 2003 | 95.4% | 1.6% | 0.25% | 0.6% | 1.9% | 0.6% | |
| February 2003 | 95.2% | 1.2% | 0.11% | 0.7% | 1.9% | 1.0% | |
| December 2002 | 95.0% | 1.1% | 0.8% | 1.9% | 1.1% | ||
| September 2002 | 94.9% | 0.8% | 0.9% | 1.8% | 1.2% | ||
| June 2002 | 95.3% | 0.4% | 0.7% | 1.5% | 1.9% | ||
| April 2002 | 96.6% | 0.5% | 0.7% | 2.1% |
| Period |
Internet Explorer |
Mozilla / Firefox |
Safari |
Chrome |
Opera |
Netscape |
|---|---|---|---|---|---|---|
| March 2009 | 72.69% | 20.40% | 4.53% | 1.05% | 0.38% | 0.49% |
| November 2008 | 75.54% | 18.74% | 3.95% | 0.62% | 0.39% | 0.50% |
| June 2007 | 75.69% | 19.65% | 3.77% | 0.61% | 0.17% | |
| January 2007 | 78.13% | 16.11% | 3.68% | 0.73% | 0.18% |
| Period |
Internet Explorer |
Mozilla / Firefox |
Safari |
Chrome |
Opera |
Netscape |
|---|---|---|---|---|---|---|
| March 2009 | 65.55% | 23.09% | 7.36% | 1.32% | 0.75% | 0.56% |
| November 2008 | 69.67% | 20.38% | 7.56% | 0.92% | 0.76% | 0.56% |
| June 2007 | 75.76% | 16.47% | 5.72% | 0.69% | 0.13% | |
| January 2007 | 79.00% | 14.13% | 4.70% | 0.71% | 0.14% |
| Period |
Internet Explorer |
Mozilla / Firefox |
Safari |
Chrome |
Opera |
Netscape |
|---|---|---|---|---|---|---|
| March 2009 | 80.91% | 15.16% | 1.94% | 0.85% | 0.60% | 0.36% |
| November 2008 | 83.77% | 11.45% | 1.76% | 0.43% | 0.60% | 0.34% |
| June 2007 | 86.00% | 11.22% | 1.61% | 0.53% | 0.10% | |
| January 2007 | 86.72% | 10.86% | 1.78% | 0.49% | 0.10% |
| Period |
Internet Explorer |
Mozilla / Firefox |
Safari |
Chrome |
Opera |
Netscape |
|---|---|---|---|---|---|---|
| June 2007 | 66.42% | 26.32% | 1.86% | 4.05% | 0.24% | |
| January 2007 | 65.71% | 26.68% | 1.77% | 4.28% | 0.24% |
| Period |
Internet Explorer |
Mozilla / Firefox |
Safari |
Chrome |
Opera |
Netscape |
|---|---|---|---|---|---|---|
| March 2009 | 71.57% | 23.48% | 2.90% | 0.86% | 0.54% | 0.46% |
| November 2008 | 71.50% | 23.45% | 3.23% | 0.59% | 0.56% | 0.51% |
ADTECH (Europe, 2004 to Q4 2009)
| Period |
Internet Explorer |
Firefox |
Safari |
Chrome |
Opera |
Mozilla |
Netscape |
|---|---|---|---|---|---|---|---|
| Q4 2009 | 63.6% | 26.7% | 3.6% | 2.8% | 1.7% | 0.7% | |
| Q1 2009 | 67.7% | 25.3% | 2.6% | 1.0% | 1.4% | 1.1% | |
| Q1 2008 | 76.2% | 18.1% | 1.7% | 1.0% | 2.6% | ||
| Q4 2007 | 76.0% | 18.0% | 1.6% | 1.0% | 2.9% | ||
| July 2007 | 77.5% | 15.5% | 1.6% | 0.9% | 3.9% | ||
| February 2007 | 77.34% | 14.34% | 1.63% | 0.85% | 5.11% | ||
| February–April 2006 | 83.36% | 12.38% | 1.67% | 0.77% | 0.82% | 0.38% | |
| September 2005 | 83.31% | 12.41% | 1.40% | 0.90% | 1.06% | 0.61% | |
| June 2005 | 85.10% | 10.11% | 1.34% | 1.21% | 1.05% | 0.60% | |
| March 2005 | 86.73% | 8.96% | 1.12% | 1.14% | 0.71% | ||
| February 2005 | 87.57% | 7.85% | 1.05% | 1.26% | 0.76% | ||
| January 2005 | 87.13% | 7.43% | 1.70% | 1.33% | 0.85% | ||
| November 30, 2004 | 89.47% | 5.51% | 1.01% | 2.50% | 0.92% | ||
| November 16, 2004 | 90.56% | 4.56% | 1.07% | 2.38% | 0.89% | ||
| September 2004 | 92.63% | 2.91% | 1.00% | 2.10% | 0.82% | ||
| August 2004 | 93.08% | 2.15% | 0.89% | 2.18% | 0.95% | ||
| July 2004 | 93.08% | 1.64% | 0.99% | 2.62% | 0.97% | ||
| January–April 2004 | 94.72% | 0.73% | 2.50% | 1.49% |
AT Internet Institute (Europe, July 2007 to June 2010)
AT Internet Institute was formerly known as XiTi.
Methodology: Only counts visits to local sites in 23 European countries and then averages the percentages for those 23 European countries independent of population size.
| Date | Internet Explorer | Netscape | Firefox | Opera | Safari | Chrome | Source |
|---|---|---|---|---|---|---|---|
| June 2010 | 53.8% | 30.6% | 2.4% | 6.8% | 5.7% | 2010-6 | |
| March 2010 | 57.1% | 29.6% | 2.2% | 5.2% | 5.3% | 2010-3 | |
| September 2009 | 62.0% | 28.4% | 2.2% | 4.3% | 2.8% | 2009-11 | |
| April 2009 | 63.6% | 0.6% | 28.4% | 2.2% | 3.4% | 1.7% | 2009-5 |
| March 2009 | 64.6% | 0.6% | 27.8% | 2.2% | 3.3% | 1.4% | |
| February 2009 | 65.6% | 0.5% | 27.4% | 2.1% | 3.0% | 1.3% | |
| January 2009 | 58.1% | 0.6% | 32.5% | 4.1% | 3.0% | 1.5% | 2009-1 |
| December 2008 | 58.5% | 0.6% | 32.3% | 4.5% | 2.7% | 1.3% | |
| November 2008 | 59.5% | 0.6% | 31.1% | 5.1% | 2.5% | 1.1% | 2008-12-22 |
| October 2008 | 59.2% | 0.6% | 31.1% | 5.4% | 2.4% | 1.1% | |
| September 2008 | 60.2% | 0.4% | 31.2% | 4.8% | 2.4% | 1.0% | 2008-10-10 |
| August 2008 | 59.4% | 0.3% | 33.0% | 4.5% | 2.6% | ||
| July 2008 | 60.4% | 0.3% | 32.2% | 4.5% | 2.4% | ||
| June 2008 | 60.5% | 0.3% | 31.4% | 5.1% | 2.5% | ||
| May 2008 | 61.7% | 0.4% | 30.7% | 4.7% | 2.4% | ||
| April 2008 | 64.5% | 0.5% | 28.9% | 3.6% | 2.4% | ||
| March 2008 | 65.0% | 0.5% | 28.8% | 3.3% | 2.3% | 2008-04-30 | |
| February 2008 | 65.6% | 0.5% | 28.5% | 3.2% | 2.2% | ||
| January 2008 | 66.1% | 0.5% | 28.0% | 3.2% | 2.1% | ||
| December 2007 | 66.1% | 0.5% | 28.0% | 3.3% | 2.0% | ||
| November 2007 | 66.9% | 0.5% | 27.3% | 3.2% | 1.9% | ||
| October 2007 | 67.5% | 0.4% | 27.0% | 3.1% | 1.8% | ||
| September 2007 | 66.6% | 0.3% | 27.7% | 3.4% | 1.8% | 2007-10-30 | |
| July 2–8, 2007 | 66.5% | 0.3% | 27.8% | 3.5% | 1.7% | 2007-07-18 |
WebSideStory (USA, February 1999 to June 2006)
| Date | Internet Explorer | Netscape / Mozilla | Firefox | Source |
|---|---|---|---|---|
| June 2006 | 86.64% | 9.95% | July 19, 2006 | |
| January 5, 2006 | 87.63% | 8.88% | Jan. 12, 2006 | |
| November 4, 2005 | 88.16% | 1.61% | 8.13% | November 10, 2005 |
| September 23, 2005 | 88.46% | 1.69% | 7.86% | September 27, 2005 |
| April 29, 2005 | 88.86% | 2.23% | 6.75% | May 10, 2005 |
| February 18, 2005 | 89.85% | 2.47% | 5.69% | Feb. 28, 2005 |
| January 14, 2005 | 90.28% | 2.64% | 4.95% | |
| December 3, 2004 | 91.80% | 2.83% | 4.06% | |
| November 5, 2004 | 92.89% | 2.95% | 3.03% | |
| October 8, 2004 | 93.21% | 3.05% | 2.66% | December 13, 2004 |
| June 4, 2004 | 95.48% | 3.53% | ||
| August 26, 2002 | 95.97% | 3.39% | August 28, 2002 | |
| October 25, 2001 | 89.03% | 10.47% | October 31, 2001 | |
| April 25, 2001 | 86.61% | 13.10% | May 1, 2001 | |
| February 21, 2001 | 87.71% | 12.01% | February 22, 2001 | |
| June 18, 2000 | 86.08% | 13.90% | ||
| August 2, 1999 | 75.31% | 24.68% | August 9, 1999 | |
| April 6, 1999 | 68.75% | 29.46% | April 7, 1999 | |
| March 1, 1999 | 66.90% | 31.21% | March 2, 1999 | |
| February 8, 1999 | 64.60% | 33.43% | February 22, 2001 |
GVU WWW user survey (January 1994 to October 1998)
| Date | Mosaic | Netscape Navigator | Internet Explorer | Source |
|---|---|---|---|---|
| October 1998 | 64% | 32.2% | Primary Browser in 12 Months | |
| April 1998 | 70% | 22.7% | Browser Expected to Use in 12 Months | |
| October 1997 | 59.67% | 15.13% | Browser Expected to Use in 12 Months | |
| April 1997 | 81.13% | 12.13% | Browser Expected to Use in 12 Months | |
| October 1996 | 80.45% | 12.18% | Browser Expected to Use in 12 Months | |
| April 1996 | 89.36% | 3.76% | Browser Expected to Use in 12 Months | |
| April 1995 | 9% | 54% | Hal Berghel's Cybernautica - "A Web Monopoly" | |
| October 1994 | 68% | 18% | Result Graph - Browser | |
| January 1994 | 97% | General Results Graphs |
EWS Web Server at UIUC (1996 Q2 to 1998)
| Date | Mosaic | Internet Explorer | Netscape Navigator | Source |
|---|---|---|---|---|
| 1998 Q4 | 50.43% | 46.87% | Oct 1998 , Nov 1998 , Dec 1998 | |
| 1998 Q3 | 47.90% | 48.97% | Jul 1998 , Aug 1998 , Sep 1998 | |
| 1998 Q2 | 43.17% | 53.57% | Apr 1998 , May 1998 , Jun 1998 | |
| 1998 Q1 | 39.67% | 57.63% | Jan 1998 , Feb 1998 , Mar 1998 | |
| 1997 Q4 | 35.53% | 62.23% | Oct 1997 , Nov 1997 , Dec 1997 | |
| 1997 Q3 | 32.40% | 64.93% | Jul 1997 , Aug 1997 , Sep 1997 | |
| 1997 Q2 | 0.37% | 27.67% | 69.77% | Apr 1997 , May 1997 , Jun 1997 |
| 1997 Q1 | 0.60% | 22.87% | 74.33% | Jan 1997, Feb 1997 , Mar 1997 |
| 1996 Q4 | 1.20% | 19.07% | 77.13% | Oct 1996 , Nov 1996 , Dec 1996 |
| 1996 Q3 | 2.47% | 13.97% | 80.37% | Jul 1996 , Aug 1996 , Sep 1996 |
| 1996 Q2 | 6.93% | 9.60% | 82.77% | Apr 1996 , May 1996 , Jun 1996 |
ZD Market Intelligence (USA, January 1997 to January 1998)
| Date | Internet Explorer | Netscape Navigator | Source |
|---|---|---|---|
| January 1998 | 39% | 54% | Behind the numbers: Browser market share |
| January 1997 | 21% | 63% |
Zona Research (USA, January 1997 to July 1998)
| Date | Internet Explorer | Netscape Navigator | Source |
|---|---|---|---|
| July 1998 | 45% | 54% | Behind the numbers: Browser market share |
| September 1997 | 36% | 62% | |
| January 1997 | 28% | 70% |
AdKnowledge (January 1998 to June 1998)
| Date | Internet Explorer | Netscape Navigator | Source |
|---|---|---|---|
| June 1998 | 46% | 52% | Behind the numbers: Browser market share |
| March 1998 | 42% | 57% | |
| January 1998 | 36% | 61% |
Dataquest (1995 to 1997)
| Date | Internet Explorer | Netscape Navigator | Source |
|---|---|---|---|
| 1997 | 39.4% | 57.6% | Browser wars: High price, huge rewards |
| 1996 | 20% | 73% | |
| 1995 | 2.9% | 80.1% |
International Data Corporation (USA, 1996 to 1997)
| Date | Internet Explorer | Netscape Navigator | Source |
|---|---|---|---|
| 1997 | 23% | 51% | Behind the numbers: Browser market share |
| 1996 | 16% | 55% |
Related pages
- List of web browsers
- Usage share, Market share
Images for kids
-
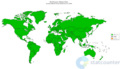
The most used web browser per country in November 2020.
-
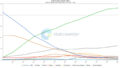
Usage share of web browsers according to StatCounter.
-
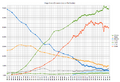
Usage share of web browsers according to StatCounter till 2019-05. See HTML5 beginnings, Presto rendering engine deprecation and Chrome's dominance.

.png)

